絕代佳人何其美?顏值高又 ![]()
![]() 顏色好!古初造字存意指,
顏色好!古初造字存意指,
長恨歌‧白居易
漢皇重色思傾國,御宇多年求不得。
楊家有女初長成,養在深閨人未識。
天生麗質難自棄,一朝選在君王側。
回眸一笑百媚生,六宮粉黛無顏色。
春寒賜浴華清池,溫泉水滑洗凝脂。
侍兒扶起嬌無力,始是新承恩澤時。
雲鬢花顏金步搖,芙蓉帳暖度春宵。
春宵苦短日高起,從此君王不早朝。
承歡侍宴無閑暇,春從春遊夜專夜。
後宮佳麗三千人,三千寵愛在一身。
金屋妝成嬌侍夜,玉樓宴罷醉和春。
姊妹弟兄皆列土,可憐光彩生門戶。
遂令天下父母心,不重生男重生女。
驪宮高處入青雲,仙樂風飄處處聞。
緩歌慢舞凝絲竹,盡日君王看不足。
漁陽鼙鼓動地來,驚破霓裳羽衣曲。
九重城闕煙塵生,千乘萬騎西南行。
翠華搖搖行復止,西出都門百餘里。
六軍不發無奈何,宛轉蛾眉馬前死。
花鈿委地無人收,翠翹金雀玉搔頭。
君王掩面救不得,回看血淚相和流。
黃埃散漫風蕭索,雲棧縈紆登劒閣。
峨嵋山下少人行,旌旗無光日色薄。
蜀江水碧蜀山青,聖主朝朝暮暮情。
行宮見月傷心色,夜雨聞鈴腸斷聲。
天旋日轉迴龍馭,到此躊躇不能去。
馬嵬坡下泥土中,不見玉顏空死處。
君臣相顧盡沾衣,東望都門信馬歸。
歸來池苑皆依舊,太液芙蓉未央柳。
芙蓉如面柳如眉,對此如何不淚垂。
春風桃李花開日,秋雨梧桐葉落時。
西宮南內多秋草,落葉滿階紅不掃。
梨園弟子白髮新,椒房阿監青娥老。
夕殿螢飛思悄然,孤燈挑盡未成眠。
遲遲鐘鼓初長夜,耿耿星河欲曙天。
鴛鴦瓦冷霜華重,翡翠衾寒誰與共。
悠悠生死別經年,魂魄不曾來入夢。
臨邛道士鴻都客,能以精誠致魂魄。
為感君王輾轉思,遂教方士殷勤覓。
排空馭氣奔如電,升天入地求之遍。
上窮碧落下黃泉,兩處茫茫皆不見。
忽聞海上有仙山,山在虛無縹緲間。
樓閣玲瓏五雲起,其中綽約多仙子。
中有一人字太真,雪膚花貌參差是。
金闕西廂叩玉扃,轉教小玉報雙成。
聞道漢家天子使,九華帳裏夢魂驚。
攬衣推枕起徘徊,珠箔銀屏迤邐開。
雲髻半偏新睡覺,花冠不整下堂來。
風吹仙袂飄颻舉,猶似霓裳羽衣舞。
玉容寂寞淚闌干,梨花一枝春帶雨。
含情凝睇謝君王,一別音容兩渺茫。
昭陽殿裏恩愛絕,蓬萊宮中日月長。
回頭下望人寰處,不見長安見塵霧。
唯將舊物表深情,鈿合金釵寄將去。
釵留一股合一扇,釵擘黃金合分鈿。
但教心似金鈿堅,天上人間會相見。
臨別殷勤重寄詞,詞中有誓兩心知。
七月七日長生殿,夜半無人私語時。
在天願作比翼鳥,在地願為連理枝。
天長地久有時盡,此恨綿綿無絕期。
詩仙『比擬』清平調︰
清平調‧李白
雲想衣裳花想容,春風拂檻露華濃。
若非羣玉山頭見,會向瑤臺月下逢。
一枝紅艷露凝香,雲雨巫山枉斷腸。
借問漢宮誰得似?可憐飛燕倚新妝!
名花傾國兩相歡,長得君王帶笑看。
觧釋春風無限恨,沈香亭北倚闌干。
全唐詩·卷164 天寶中,白供奉翰林。禁中初重木芍藥,得四本紅紫淺紅通白者,移植於興慶池東沈香亭。會花開,上乘照夜白,太真妃以步輦從。詔選梨園中弟子尤者,得樂一十六色。李龜年以歌擅一時,手捧檀板,押衆樂前,欲歌之。上曰:「賞名花,對妃子,焉用舊樂詞?」遂命龜年持金花牋,宣賜李白,立進《清平調》三章。白承詔,宿酲未解,因援筆賦之。龜年歌之,太真持頗梨七寶杯,酌西涼州蒲萄酒,笑領歌詞,意甚厚。上因調玉笛以倚曲,每曲徧將換,則遲其聲以媚之。太真飲罷,斂繡巾重拜。上自是顧李翰林尤異於他學士。
色入離 ☲ 目心火生,文字難寫飲水 ☵ 人。
生生不息如來藏?物理心理融一詞!
Color
Color (American English) or colour (Commonwealth English) is the characteristic of human visual perception described through color categories, with names such as red, yellow, purple, or blue. This perception of color derives from the stimulation of cone cells in the human eye by electromagnetic radiation in the spectrum of light. Color categories and physical specifications of color are associated with objects through the wavelength of the light that is reflected from them. This reflection is governed by the object’s physical properties such as light absorption, emission spectra, etc.
By defining a color space, colors can be identified numerically by coordinates. The RGB color space for instance is a color space corresponding to human trichromacy and to the three cone cell types that respond to three bands of light: long wavelengths, peaking near 564–580 nm (red); medium-wavelength, peaking near 534–545 nm (green); and short-wavelength light, near 420–440 nm (blue).[1][2] There may also be more than three color dimensions in other color spaces, such as in the CMYK color model, wherein one of the dimensions relates to a colour’s colorfulness).
The photo-receptivity of the “eyes” of other species also varies considerably from our own and so results in correspondingly different color perceptions that cannot readily be compared to one another. Honeybees and bumblebees for instance have trichromatic color vision sensitive to ultraviolet (an electromagnetic radiation with a wavelength from 10 nm (30 PHz) to 400 nm (750 THz), shorter than that of visible light but longer than X-rays) but is insensitive to red. Papilio butterflies possess six types of photoreceptors and may have pentachromatic vision.[3] The most complex color vision system in the animal kingdom has been found in stomatopods (such as the mantis shrimp) with up to 12 spectral receptor types thought to work as multiple dichromatic units.[4]
The science of color is sometimes called chromatics, colorimetry, or simply color science. It includes the perception of color by the human eye and brain, the origin of color in materials, color theory in art, and the physics of electromagnetic radiation in the visible range (that is, what is commonly referred to simply as light).

Colored pencils
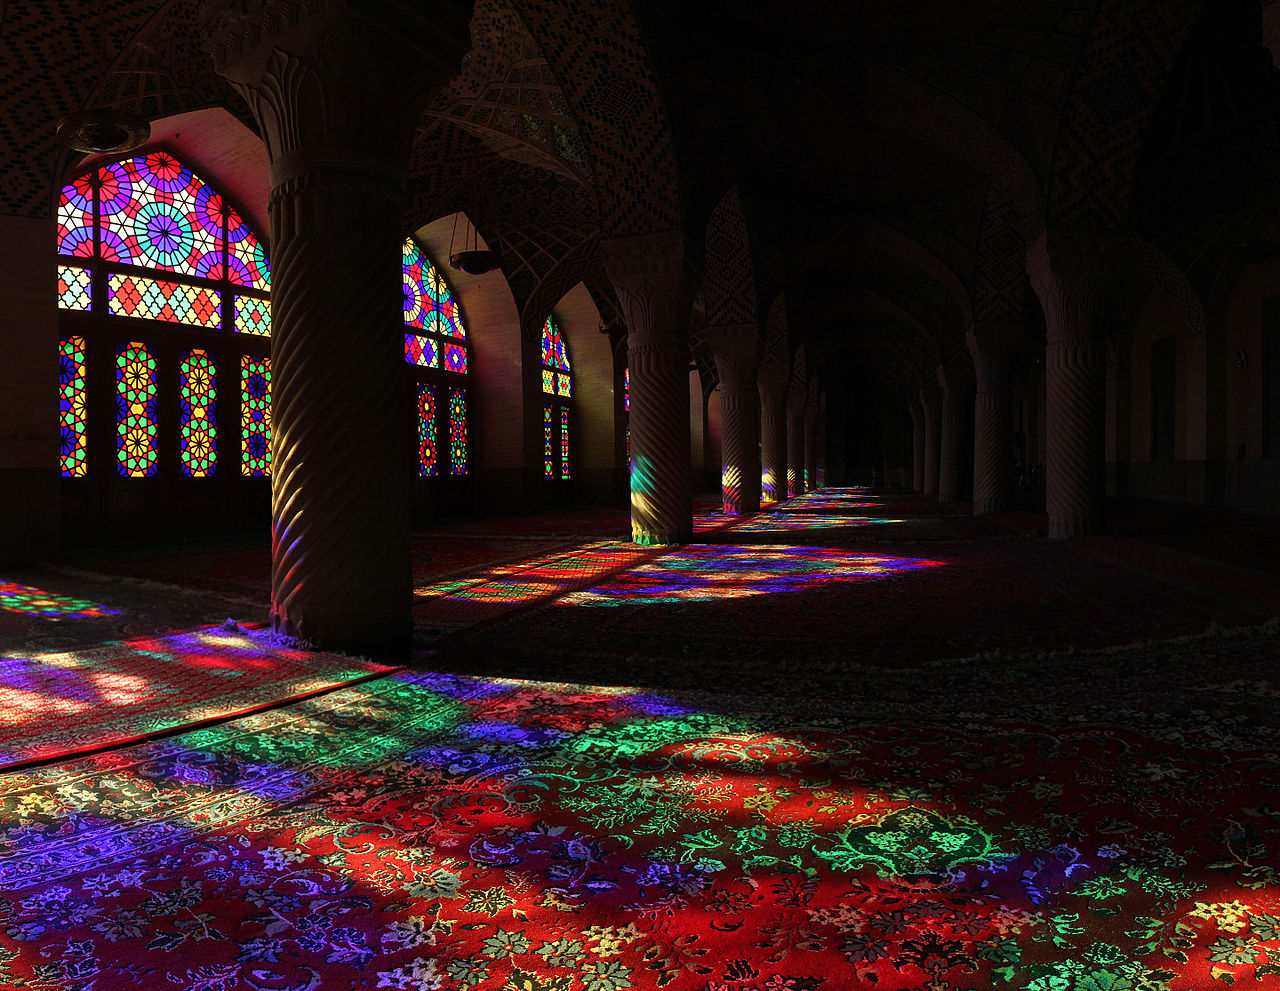
Color effect – Sunlight shining through stained glass onto carpet (Nasir ol Molk Mosque located in Shiraz, Iran)

Colors can appear different depending on their surrounding colors and shapes. The two small squares have exactly the same color, but the right one looks slightly darker.
由於『顏色』『質感』深︰
Qualia
In philosophy and certain models of psychology, qualia (/ˈkwɑːliə/ or /ˈkweɪliə/; singular form: quale) are claimed to be individual instances of subjective, conscious experience. The term qualia derives from the Latin neuter plural form (qualia) of the Latin adjective quālis (Latin pronunciation: [ˈkʷaːlɪs]) meaning “of what sort” or “of what kind” in a specific instance like “what is it like to taste a specific orange, this particular orange now”. Examples of qualia include the pain of a headache, the taste of wine, and the perceived redness of an evening sky. As qualitative characters of sensation, qualia stand in contrast to “propositional attitudes“.[1] where the focus is on beliefs about experience rather than what is it directly like to be experiencing.
Philosopher and cognitive scientist Daniel Dennett once suggested that qualia was “an unfamiliar term for something that could not be more familiar to each of us: the ways things seem to us”.[2]
Much of the debate over their importance hinges on the definition of the term, and various philosophers emphasize or deny the existence of certain features of qualia. Consequently, the nature and existence of various definitions of qualia remain controversial in light of the fact that the existence of qualia has never been independently and scientifically proven as fact.
光譜數學難為功︰
Physics of color
Electromagnetic radiation is characterized by its wavelength (or frequency) and its intensity. When the wavelength is within the visible spectrum (the range of wavelengths humans can perceive, approximately from 390 nm to 700 nm), it is known as “visible light”.
Most light sources emit light at many different wavelengths; a source’s spectrum is a distribution giving its intensity at each wavelength. Although the spectrum of light arriving at the eye from a given direction determines the color sensation in that direction, there are many more possible spectral combinations than color sensations. In fact, one may formally define a color as a class of spectra that give rise to the same color sensation, although such classes would vary widely among different species, and to a lesser extent among individuals within the same species. In each such class the members are called metamers of the color in question.

Continuous optical spectrum rendered into the sRGB color space.
Spectral colors
The familiar colors of the rainbow in the spectrum – named using the Latin word for appearance or apparition by Isaac Newton in 1671 – include all those colors that can be produced by visible light of a single wavelength only, the pure spectral or monochromatic colors. The table at right shows approximate frequencies (in terahertz) and wavelengths (in nanometers) for various pure spectral colors. The wavelengths listed are as measured in air or vacuum (see refractive index).
The color table should not be interpreted as a definitive list – the pure spectral colors form a continuous spectrum, and how it is divided into distinct colors linguistically is a matter of culture and historical contingency (although people everywhere have been shown to perceive colors in the same way[6]). A common list identifies six main bands: red, orange, yellow, green, blue, and violet. Newton’s conception included a seventh color, indigo, between blue and violet. It is possible that what Newton referred to as blue is nearer to what today is known as cyan, and that indigo was simply the dark blue of the indigo dye that was being imported at the time.[7]
The intensity of a spectral color, relative to the context in which it is viewed, may alter its perception considerably; for example, a low-intensity orange-yellow is brown, and a low-intensity yellow-green is olive-green.
Color of objects
The color of an object depends on both the physics of the object in its environment and the characteristics of the perceiving eye and brain. Physically, objects can be said to have the color of the light leaving their surfaces, which normally depends on the spectrum of the incident illumination and the reflectance properties of the surface, as well as potentially on the angles of illumination and viewing. Some objects not only reflect light, but also transmit light or emit light themselves, which also contribute to the color. A viewer’s perception of the object’s color depends not only on the spectrum of the light leaving its surface, but also on a host of contextual cues, so that color differences between objects can be discerned mostly independent of the lighting spectrum, viewing angle, etc. This effect is known as color constancy.

The upper disk and the lower disk have exactly the same objective color, and are in identical gray surroundings; based on context differences, humans perceive the squares as having different reflectances, and may interpret the colors as different color categories; see checker shadow illusion.
Some generalizations of the physics can be drawn, neglecting perceptual effects for now:
- Light arriving at an opaque surface is either reflected “specularly” (that is, in the manner of a mirror), scattered (that is, reflected with diffuse scattering), or absorbed – or some combination of these.
- Opaque objects that do not reflect specularly (which tend to have rough surfaces) have their color determined by which wavelengths of light they scatter strongly (with the light that is not scattered being absorbed). If objects scatter all wavelengths with roughly equal strength, they appear white. If they absorb all wavelengths, they appear black.[8]
- Opaque objects that specularly reflect light of different wavelengths with different efficiencies look like mirrors tinted with colors determined by those differences. An object that reflects some fraction of impinging light and absorbs the rest may look black but also be faintly reflective; examples are black objects coated with layers of enamel or lacquer.
- Objects that transmit light are either translucent (scattering the transmitted light) or transparent (not scattering the transmitted light). If they also absorb (or reflect) light of various wavelengths differentially, they appear tinted with a color determined by the nature of that absorption (or that reflectance).
- Objects may emit light that they generate from having excited electrons, rather than merely reflecting or transmitting light. The electrons may be excited due to elevated temperature (incandescence), as a result of chemical reactions (chemoluminescence), after absorbing light of other frequencies (“fluorescence” or “phosphorescence“) or from electrical contacts as in light emitting diodes, or other light sources.
To summarize, the color of an object is a complex result of its surface properties, its transmission properties, and its emission properties, all of which contribute to the mix of wavelengths in the light leaving the surface of the object. The perceived color is then further conditioned by the nature of the ambient illumination, and by the color properties of other objects nearby, and via other characteristics of the perceiving eye and brain.
如何話說自家事?!假借『經驗』求『證印』☆
ColorPy – A Python package for handling physical descriptions of color and light spectra.
Introduction and Motivation
ColorPy is a Python package that can convert physical descriptions of light – spectra of light intensity vs. wavelength – into RGB colors that can be drawn on a computer screen. It provides a nice set of attractive plots that you can make of such spectra, and some other color related functions as well. All of the plots in this documentation were created with ColorPy.
ColorPy is free software. (‘Free’ as in speech and beer.) It is released under the GNU Lesser GPL license. You are free to use ColorPy for any application that you like, including commercial applications. If you modify ColorPy, you should release the source code for your modifications. You have no obligation to release any source for your products that just use ColorPy, however.
Several years ago, I developed some C++ code to do these kinds of physical color calculations. Recently, I decided to port the code to Python, and publish the library as open source under the GNU LGPL license. I decided to make use of (and assume the existence of) NumPy and MatPlotLib for this. These libraries make it easy to make some nice, attractive, and informative, plots of spectra. Besides, Python is just more fun than C++.
So what can ColorPy do? The short answer, is to scan this document, and examine the various plots of spectra and their colors. You can use ColorPy to make the same kinds of plots, for whatever spectra you have and are interested in. ColorPy also provides conversions between several important three-dimensional ‘color spaces’, specifically RGB, XYZ, Luv, and Lab. (There can be many different RGB spaces, depending on the particular display used to view the results. By default, ColorPy uses the sRGB space, but you can configure it to use other RGB spaces if you like.)
License
Copyright (C) 2008 Mark Kness
Author – Mark Kness – mkness@alumni.utexas.net
ColorPy is free software: you can redistribute it and/or modify it under the terms of the GNU Lesser General Public License as published by the Free Software Foundation, either version 3 of the License, or (at your option) any later version. ColorPy is distributed in the hope that it will be useful, but WITHOUT ANY WARRANTY; without even the implied warranty of MERCHANTABILITY or FITNESS FOR A PARTICULAR PURPOSE. See the GNU Lesser General Public License for more details. You should have received a copy of the GNU Lesser General Public License along with ColorPy. If not, see http://www.gnu.org/licenses/.
Prerequisites
To use ColorPy, you must have installed the following: Python, NumPy, and MatPlotLib. Typically, SciPy is installed along with NumPy and MatPlotLib. ColorPy doesn’t use SciPy explicitly, although MatPlotLib may require SciPy. (I am not sure.) ColorPy is a ‘pure’ Python distribution, so you do not need any extra software to build it. I have tested ColorPy both on Windows XP and Ubuntu Linux, and it should run on any system where you can install the prerequisites. If, for some reason, you can only install NumPy but not MatPlotLib, you should still be able to do many of the calculations, but will not be able to make any of the nice plots.
Types and Units
ColorPy generally uses wavelengths measured in nanometers (nm), 10-9 m. Otherwise, typical metric units are used. For descriptions of spectra, ColorPy uses two-dimensional NumPy arrays, with two columns and an arbitrary number of rows. Each row of these arrays represents the light intensity for one wavelength, with the value in the first column being the wavelength in nm, and the value in the second column being the light intensity at that wavelength. ColorPy can provide a blank spectrum array, via colorpy.ciexyx.empty_spectrum(), which will have rows for each wavelength from 360 nm to 830 nm, at 1 nm increments. (Wavelengths outside this range are generally ignored, as the eye cannot see them.) However, you can create your own spectrum arrays with any set of wavelengths you like.
Color values are represented as three-component NumPy vectors. (One-dimensional arrays). Typically, these are vectors of floats, with the exception of displayable irgb colors, which are arrays of integers (in the range 0 – 255).
Fundamentals – Mapping spectra to three-dimensional color values
We are interested in working with physical descriptions of light spectra, that is, functions of intensity vs. wavelength. However, color is perceived as a three-dimensional quantity, as there are three sets of color receptors in the eye, which respond approximately to red, green and blue light. So how do we reduce a function of intensity vs. wavelength to a three-dimensional value?
This fundamental step is done by integrating the intensity function with a set of three matching functions. The standard matching functions were defined by the Commission Internationale de l’Eclairage (CIE), based on experiments with viewers matching the color of single wavelength lights. The matching functions generally used in computer graphics are those developed in 1931, which used a 2 degree field of view. (There is also a set of matching functions developed in 1964, covering a field of view of 10 degrees, but the larger field of view does not correspond to typical conditions in viewing computer graphics.) So the mapping is done as follows:
X = ∫ I (λ) * CIE-X (λ) * dλ
Y = ∫ I (λ) * CIE-Y (λ) * dλ
Z = ∫ I (λ) * CIE-Z (λ) * dλ
where I (λ) is the spectrum of light intensity vs. wavelength, and CIE-X (λ), CIE-Y (λ) and CIE-Z (λ) are the matching functions. The CIE matching functions are defined over the interval of 360 nm to 830 nm, and are zero for all wavelengths outside this interval, so these are the bounds for the integrals.
So what do these matching functions look like? Let’s take a look at a plot (made with ColorPy, of course.)
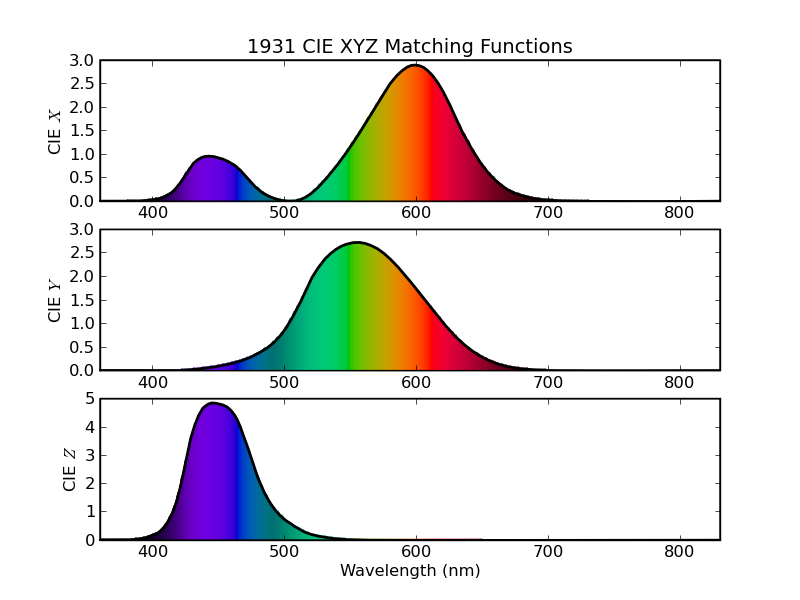
Figure 1 – The 1931 CIE XYZ matching functions.
This plot shows the three matching functions vs. wavelength. The colors underneath the curve, at each wavelength, are the (approximate) colors that the human eye will perceive for a pure spectral line at that wavelength, of constant intensity. The apparent brightness of the color at each wavelength indicates how strongly the eye perceives that wavelength – the intensity for each wavelength is the same. (The next section will explain how we get the RGB values for the colors.)