『知覺』非『覺知』︰
Perception
Development of theories of color vision
Although Aristotle and other ancient scientists had already written on the nature of light and color vision, it was not until Newton that light was identified as the source of the color sensation. In 1810, Goethe published his comprehensive Theory of Colors in which he ascribed physiological effects to color that are now understood as psychological.
In 1801 Thomas Young proposed his trichromatic theory, based on the observation that any color could be matched with a combination of three lights. This theory was later refined by James Clerk Maxwell and Hermann von Helmholtz. As Helmholtz puts it, “the principles of Newton’s law of mixture were experimentally confirmed by Maxwell in 1856. Young’s theory of color sensations, like so much else that this marvelous investigator achieved in advance of his time, remained unnoticed until Maxwell directed attention to it.”[10]
At the same time as Helmholtz, Ewald Hering developed the opponent process theory of color, noting that color blindness and afterimages typically come in opponent pairs (red-green, blue-orange, yellow-violet, and black-white). Ultimately these two theories were synthesized in 1957 by Hurvich and Jameson, who showed that retinal processing corresponds to the trichromatic theory, while processing at the level of the lateral geniculate nucleus corresponds to the opponent theory.[11]
In 1931, an international group of experts known as the Commission internationale de l’éclairage (CIE) developed a mathematical color model, which mapped out the space of observable colors and assigned a set of three numbers to each.
『客觀』逢『主觀』︰
Color in the eye

The ability of the human eye to distinguish colors is based upon the varying sensitivity of different cells in the retina to light of different wavelengths. Humans are trichromatic—the retina contains three types of color receptor cells, or cones. One type, relatively distinct from the other two, is most responsive to light that is perceived as blue or blue-violet, with wavelengths around 450 nm; cones of this type are sometimes called short-wavelength cones, S cones, or blue cones. The other two types are closely related genetically and chemically: middle-wavelength cones, M cones, or green cones are most sensitive to light perceived as green, with wavelengths around 540 nm, while the long-wavelength cones, L cones, or red cones, are most sensitive to light is perceived as greenish yellow, with wavelengths around 570 nm.
Light, no matter how complex its composition of wavelengths, is reduced to three color components by the eye. Each cone type adheres to the Principle of Univariance, which is that each cone’s output is determined by the amount of light that falls on it over all wavelengths. For each location in the visual field, the three types of cones yield three signals based on the extent to which each is stimulated. These amounts of stimulation are sometimes called tristimulus values.
The response curve as a function of wavelength varies for each type of cone. Because the curves overlap, some tristimulus values do not occur for any incoming light combination. For example, it is not possible to stimulate only the mid-wavelength (so-called “green”) cones; the other cones will inevitably be stimulated to some degree at the same time. The set of all possible tristimulus values determines the human color space. It has been estimated that humans can distinguish roughly 10 million different colors.[9]
The other type of light-sensitive cell in the eye, the rod, has a different response curve. In normal situations, when light is bright enough to strongly stimulate the cones, rods play virtually no role in vision at all.[12] On the other hand, in dim light, the cones are understimulated leaving only the signal from the rods, resulting in a colorless response. (Furthermore, the rods are barely sensitive to light in the “red” range.) In certain conditions of intermediate illumination, the rod response and a weak cone response can together result in color discriminations not accounted for by cone responses alone. These effects, combined, are summarized also in the Kruithof curve, that describes the change of color perception and pleasingness of light as function of temperature and intensity.
『科學』未窮盡︰
Color in the brain

The visual dorsal stream (green) and ventral stream (purple) are shown. The ventral stream is responsible for color perception.
While the mechanisms of color vision at the level of the retina are well-described in terms of tristimulus values, color processing after that point is organized differently. A dominant theory of color vision proposes that color information is transmitted out of the eye by three opponent processes, or opponent channels, each constructed from the raw output of the cones: a red–green channel, a blue–yellow channel, and a black–white “luminance” channel. This theory has been supported by neurobiology, and accounts for the structure of our subjective color experience. Specifically, it explains why humans cannot perceive a “reddish green” or “yellowish blue”, and it predicts the color wheel: it is the collection of colors for which at least one of the two color channels measures a value at one of its extremes.
The exact nature of color perception beyond the processing already described, and indeed the status of color as a feature of the perceived world or rather as a feature of our perception of the world – a type of qualia – is a matter of complex and continuing philosophical dispute.
仰賴『法則』觀︰
Grassmann’s law (optics)
In optics, Grassmann’s law is an empirical result about human color perception: that chromatic sensation can be described in terms of an effective stimulus consisting of linear combinations of different light colors. It was discovered by Hermann Grassmann.
Statement

Grassmann expressed his law with respect to a circular arrangement of spectral colors in this 1853 illustration.[1]
An early statement of law, attributed to Grassmann, is:[2]
| “ | If two simple but non-complementary spectral colors be mixed with each other, they give rise to the color sensation which may be represented by a color in the spectrum lying between both and mixed with a certain quantity of white. | ” |
Modern interpretation
If a test color is the combination of two other colors, then in a matching experiment based on mixing primary light colors, an observer’s matching value of each primary will be the sum of the matching values for each of the other test colors when viewed separately.
In other words, if beam 1 and 2 are the initial colors, and the observer chooses 


Grassmann’s law can be expressed in general form by stating that for a given color with a spectral power distribution 


Observe that these are linear in 

數字聯想苦︰
Tristimulus values
The human eye with normal vision has three kinds of cone cells, which sense light, with spectral sensitivity peaks in short (S, 420 nm–440 nm), middle (M, 530 nm–540 nm), and long (L, 560 nm–580 nm) wavelengths. These cone cells underlie human color perception under medium- and high-brightness conditions (in very dim light, color vision diminishes, and the low-brightness, monochromatic “night-vision” receptors, called rod cells, take over). Thus, three parameters, corresponding to levels of stimulus of the three types of cone cells, can in principle describe any color sensation. Weighting a total light power spectrum by the individual spectral sensitivities of the three types of cone cells gives three effective stimulus values; these three values make up a tristimulus specification of the objective color of the light spectrum. The three parameters, denoted S, M, and L, can be indicated using a 3-dimensional space, called LMS color space, which is one of many color spaces which have been devised to help quantify human color vision.
A color space maps a range of physically produced colors (from mixed light, pigments, etc.) to an objective description of color sensations registered in the eye, typically in terms of tristimulus values, but not usually in the LMS space defined by the cone spectral sensitivities. The tristimulus values associated with a color space can be conceptualized as amounts of three primary colors in a tri-chromatic additive color model. In some color spaces, including LMS and XYZ spaces, the primary colors used are not real colors, in the sense that they cannot be generated with any light spectrum.
The CIE XYZ color space encompasses all color sensations that an average person can experience. That is why CIE XYZ (Tristimulus values) is a device invariant color representation.[5] It serves as a standard reference against which many other color spaces are defined. A set of color-matching functions, like the spectral sensitivity curves of the LMS space but not restricted to be nonnegative sensitivities, associates physically produced light spectra with specific tristimulus values.
Consider two light sources made up of different mixtures of various wavelengths. Such light sources may appear to be the same color; this effect is called metamerism. Such light sources have the same apparent color to an observer when they produce the same tristimulus values, no matter what the spectral power distributions of the sources are.
Most wavelengths stimulate two or all three types of cone cell, because the spectral sensitivity curves of the three types of cone cells overlap. Certain tristimulus values are thus physically impossible (for instance LMS tristimulus values that are non-zero for the M component, and zero for both L and S). Furthermore, LMS tristimulus values for pure spectral colors would, in any normal trichromatic additive color space (e.g. RGB color spaces), imply negative values for at least one of the three primaries, since the chromaticity would be outside the color triangle defined by the primary colors. To avoid these negative RGB values, and to have one component that describes the perceived brightness, “imaginary” primary colors and corresponding color-matching functions have been formulated. The resulting tristimulus values are defined by the CIE 1931 color space, in which they are denoted X, Y, and Z.[6] In XYZ space, all combinations of nonnegative coordinates are meaningful, but many such as the primary locations [1, 0, 0], [0, 1, 0], and [0, 0, 1] correspond to imaginary colors outside the space of possible LMS coordinates; imaginary colors do not correspond to any spectral distribution of wavelengths, so have no physical reality.
Meaning of X, Y and Z
When judging the relative luminance (brightness) of different colors in well-lit situations, humans tend to perceive light within the green parts of the spectrum as brighter than red or blue light of equal power. The luminosity function that describes the perceived brightnesses of different wavelengths is thus roughly analogous to the spectral sensitivity of M cones.
The CIE model capitalises on this fact by defining Y as luminance. Z is quasi-equal to blue stimulation, or the S cone response, and X is a mix (a linear combination) of cone response curves chosen to be nonnegative. The XYZ tristimulus values are thus analogous to, but different from, the LMS cone responses of the human eye. Defining Y as luminance has the useful result that for any given Y value, the XZ plane will contain all possible chromaticities at that luminance.
The unit of the tristimulus values X, Y, and Z is often arbitrarily chosen so that Y = 1 or Y = 100 is the brightest white that a color display supports. The corresponding whitepoint values for X and Z can then be inferred using the standard illuminants.
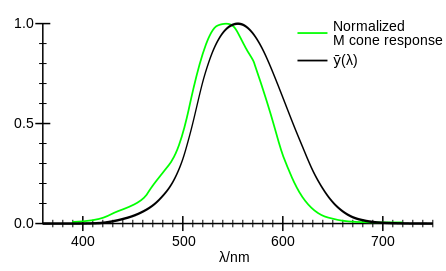
A comparison between a typical normalised M cone’s spectral sensitivity and the CIE 1931 luminosity function for a standard observer in photopic vision.
CIE standard observer
Due to the distribution of cones in the eye, the tristimulus values depend on the observer’s field of view. To eliminate this variable, the CIE defined a color-mapping function called the standard (colorimetric) observer, to represent an average human’s chromatic response within a 2° arc inside the fovea. This angle was chosen owing to the belief that the color-sensitive cones resided within a 2° arc of the fovea. Thus the CIE 1931 Standard Observer function is also known as the CIE 1931 2° Standard Observer. A more modern but less-used alternative is the CIE 1964 10° Standard Observer, which is derived from the work of Stiles and Burch,[7] and Speranskaya.[8]
For the 10° experiments, the observers were instructed to ignore the central 2° spot. The 1964 Supplementary Standard Observer function is recommended when dealing with more than about a 4° field of view. Both standard observer functions are discretized at 5 nm wavelength intervals from 380 nm to 780 nm and distributed by the CIE.[9] All corresponding values have been calculated from experimentally obtained data using interpolation. The standard observer is characterized by three color matching functions.
The derivation of the CIE standard observer from color matching experiments is given below, after the description of the CIE RGB space.
Color matching functions
 ,
,  and
and  are the numerical description of the chromatic response of the observer (described above). They can be thought of as the spectral sensitivity curves of three linear light detectors yielding the CIE tristimulus values X, Y and Z. Collectively, these three functions are known as the CIE standard observer.[10]
Other observers, such as for the CIE RGB space or other RGB color spaces, are defined by other sets of three color-matching functions, and lead to tristimulus values in those other spaces.
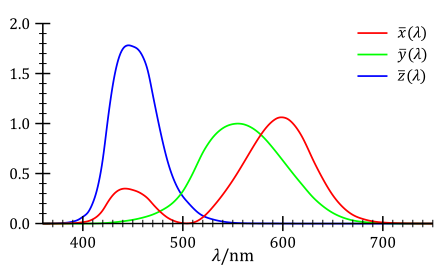
The CIE standard observer color matching functions.
隔靴搔癢難︰
RGB color model
The RGB color model is an additive color model in which red, green and blue light are added together in various ways to reproduce a broad array of colors. The name of the model comes from the initials of the three additive primary colors, red, green and blue.
The main purpose of the RGB color model is for the sensing, representation and display of images in electronic systems, such as televisions and computers, though it has also been used in conventional photography. Before the electronic age, the RGB color model already had a solid theory behind it, based in human perception of colors.
RGB is a device-dependent color model: different devices detect or reproduce a given RGB value differently, since the color elements (such as phosphors or dyes) and their response to the individual R, G and B levels vary from manufacturer to manufacturer, or even in the same device over time. Thus a RGB value does not define the same color across devices without some kind of color management.
Typical RGB input devices are color TV and video cameras, image scanners, and digital cameras. Typical RGB output devices are TV sets of various technologies (CRT, LCD, plasma, OLED, Quantum-Dots etc.), computer and mobile phone displays, video projectors, multicolor LED displays and large screens such as JumboTron. Color printers, on the other hand are not RGB devices, but subtractive color devices (typically CMYK color model).
This article discusses concepts common to all the different color spaces that use the RGB color model, which are used in one implementation or another in color image-producing technology.
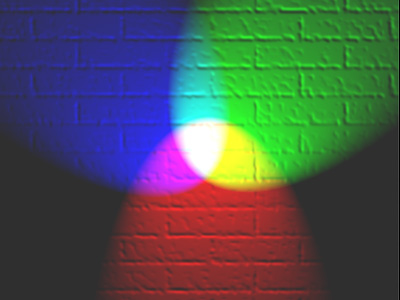
A representation of additive color mixing. Projection of primary color lights on a white screen shows secondary colors where two overlap; the combination of all three of red, green and blue in equal intensities makes white.
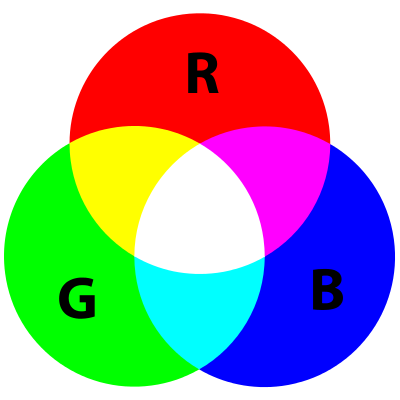
A representation of additive color mixing. Projection of primary color lights on a white screen shows secondary colors where two overlap; the combination of all three of red, green and blue in equal intensities makes white.
History of RGB color model theory and usage
The RGB color model is based on the Young–Helmholtz theory of trichromatic color vision, developed by Thomas Young and Hermann Helmholtz in the early to mid nineteenth century, and on James Clerk Maxwell‘s color triangle that elaborated that theory (circa 1860).


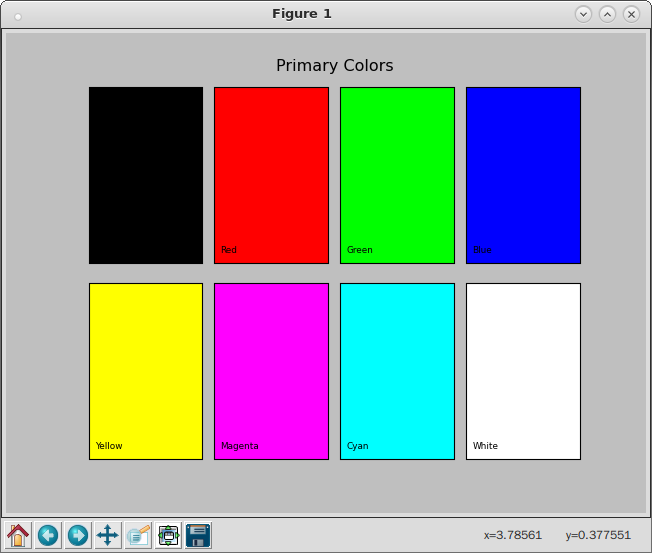
『體驗』人『自明』☆★
pi@raspberrypi:~ $ ipython3 --pylab
Python 3.4.2 (default, Oct 19 2014, 13:31:11)
Type "copyright", "credits" or "license" for more information.

IPython 2.3.0 -- An enhanced Interactive Python.
?         -> Introduction and overview of IPython's features.
%quickref -> Quick reference.
help      -> Python's own help system.
object?   -> Details about 'object', use 'object??' for extra details.
Using matplotlib backend: TkAgg

In [1]: import colorpy.misc

In [2]: 原色 = [
   ...: '#000000',
   ...: '#FF0000',
   ...: '#00FF00',
   ...: '#0000FF',
   ...: '#FFFF00',
   ...: '#FF00FF',
   ...: '#00FFFF',
   ...: '#FFFFFF'
   ...:  ]

In [3]: 原色名 = [ 'Black', 'Red', 'Green', 'Blue', 'Yellow', 'Magenta', 'Cyan', 'White' ]

In [4]: colorpy.misc.colorstring_patch_plot (原色, 原色名, 'Primary Colors', 'primary', num_across=4)
Saving plot primary

In [5]: