不久後終於抵達北岸碼頭,空蕩蕩似無人煙。月兒升的更高了,望著眼前土丘,顯的有些淒冷。或許 Mrphs 見我不言不語,因說道︰跨過面前的小山,就到了『幽境夢鄉』。再穿越『幽境夢鄉』,即達《卡夫卡村》。邊聽邊走,登上了山丘,『幽境夢鄉』在目,黑壓壓的一片,不知何處是盡頭。 Mrphs 又講起︰說來『幽境夢鄉』之名原該是『幽竟夢卿』的古稱。當地原鄉人本叫它『奇幻森林』 ,林內多有五十步高之參天巨木,樹蔭之大可蔽日,又為奇藤異草纏繞,彷彿是個天然暖房。故而林中香草靈芝常生,卵生溼生常居 。遂因此生生不斷,變異驚奇而得名。此林之中央有個『林中道』正是前往《卡夫卡村》的門徑。路底有塊大石,將入村道路分成了東西兩向。誰知一日有人卻意外的用『紫外線』拍着了這石,之後驚訝的發現其上儼然有圖文。北面刻的是『 ![]()
![]() 』,南面上頭有『
』,南面上頭有『 ![]()
![]() 』。故詢之 M♪o ,得其解為『幽竟夢卿』,然而此人以為是 M♪o 誤寫,當是作『幽境夢鄉』,於是延誤至今。這麼一說反而倒讓人好奇起來,故問︰難到 M♪o 沒有分辯。 Mrphs 接答︰據『小學堂』同學講,一回有人問過這事,老師說︰『幽竟夢卿』之本義是『
』。故詢之 M♪o ,得其解為『幽竟夢卿』,然而此人以為是 M♪o 誤寫,當是作『幽境夢鄉』,於是延誤至今。這麼一說反而倒讓人好奇起來,故問︰難到 M♪o 沒有分辯。 Mrphs 接答︰據『小學堂』同學講,一回有人問過這事,老師說︰『幽竟夢卿』之本義是『 ![]() 』幽靜將『
』幽靜將『 ![]() 』盡,此景恐不再,或終『
』盡,此景恐不再,或終『 ![]() 』在夢裡相『
』在夢裡相『 ![]() 』向。總帶著點『傷春悲秋』之意。錯讀為『幽境夢鄉』沒什麼不好的吧!!多少可以『安定人心』的啊??
』向。總帶著點『傷春悲秋』之意。錯讀為『幽境夢鄉』沒什麼不好的吧!!多少可以『安定人心』的啊??
只覺一時惘然不知所之何境何鄉的了。或許真應該振奮精神,換個調子續彈『 Sense Hat 』的『 IMU 』inertial measurement unit 之曲的乎!!何不就反其道而行,從『實驗』起頭的哩??
Raspberry Pi Experiment: Foucault Pendulum
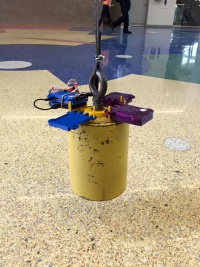
The Foucault Pendulum with some RPi’s Mounted to it
Purpose
Analyze the motion of a pendulum using an inertial measurement unit (IMU) with a Raspberry Pi.
Equipment
The following items are necessary:
- Raspberry Pi with your choice of IMU
- Scissors or snips
- Zip ties (at least 2)
- A few small pylons
- A cart
You’ll need to acquire the following pieces of equipment from the observatory:
- Extended hook
- 30 kg pendulum mass
Optional:
- Raspberry Pi mount
Procedure
- Place all your necessities on the cart and wheel it to the main floor in CCIS where the hanging solar system is.
- Grab your snips and extended hook and head up to the second floor so that you’re near to the coiled-up pendulum wire. Use the extended hook to grab the coiled up bundle and use the snips to cut the zip ties from the previous user. Gently lower the pendulum wire to the main level.
- Head back downstairs to your cart and wheel it over to where the pendulum wire is hanging. If you have a mount to secure your Pi to the pendulum, place it over the hole on top of the pendulum mass. Then grab the mounting screw hanging on the pendulum wire, and place the washer on top of your Raspberry Pi mount. Screw the wire into the pendulum mass for 6 full turns, then tighten the locking nut down onto the washer.
- Carefully lift the mass off the cart with two hands and slowly lower it until it is hanging about an inch off the ground.
- If you need to physically initiate IMU recording using a switch or some other piece of hardware, now would be a good time to to do so.
- Place the safety pylons around the desired space you want the pendulum to swing in.
- With two hands holding the pendulum mass, begin to pull it back so that the pendulum is displaced approximately 2 meters from it’s resting position. When you are ready, let the mass just slip out of your hands to minimize wobbling as it begins it’s motion.
- If you are initiating your data collection remotely (such as SSH), go ahead and do that now. Once you have collected data for around 3 minutes you should have enough data. Stop the pendulum and lift it back onto the cart. Unscrew the locking nut, and remove the screw from the mass. Make sure the washer is secured on the mounting screw.
- Grab two of your zip ties and the pendulum wire. Without letting go, walk up the stairs and around to where you cut the zip ties off from before. Coil the pendulum wire until there is no more slack. Zip tie the coil in two places and gently release it over the atrium
Analysis
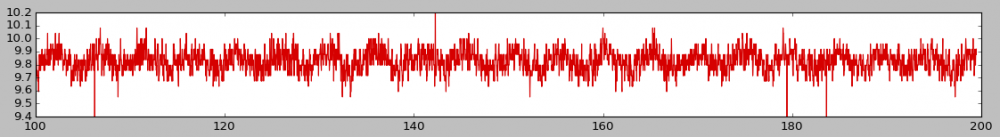
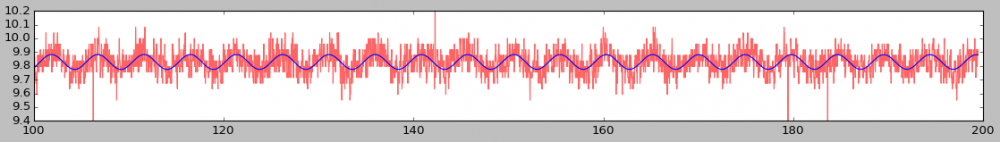
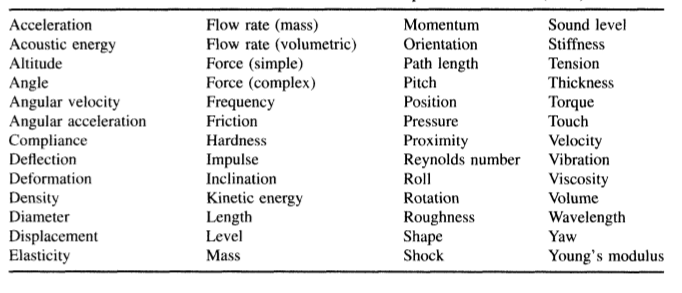
Since this pendulum is so long, the radial acceleration will be very tiny, and therefore difficult for the IMU to detect. The collected data will be very noisy and hard to analyze. So we will try to fit a sine curve to our data and use that for analysis instead. There are 3 parameters we need to obtain from our data: frequency, amplitude, and vertical displacement. You could also find the phase of the sine wave, although it is not important or relevant to your results. Make sure to trim down your data to only include the times when it is swinging on the pendulum.
Here is some sample raw data of the acceleration in the z direction vs time:
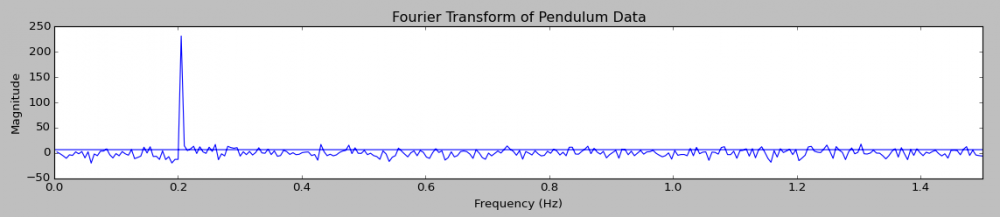
Finding the Frequency
To find the frequency of our pendulum, we’ll need to pass our data through something called a ‘Fourier transform’. It will output a graph which shows the prevalence of all the frequencies present in the original signal. There should be a large spike which will be the frequency we are looking for. This is the frequency of the radial acceleration that the Raspberry Pi experienced. This will be exactly double the frequency of the pendulum, since every time the pendulum goes through one period, the radial acceleration will go through two.
Finding the Amplitude
To find the amplitude, we’ll use the root mean square method. It utilizes the standard deviation of your data, which is a measure how ‘how spread out’ the data is. The formula you want to use for calculating it is:

- a = the amplitude of the wave
- σ = the standard deviation of your data
Finding the Vertical Displacement
If your data is trimmed down to only include times when it is swinging, the average should be equal to the vertical displacement. Luckily it is very easy to find the average. Simply sum up all of your data points, and divide by the number of them.


Determining the Length of the Pendulum
In order to find the length of the pendulum, you’ll need to make use of the value you got for the frequency. You’ll also need to know the acceleration due to gravity; you can take it to be 9.8m/s2. The following equation will also prove useful:

 and plug in your numbers.
Determining the Maximum Speed
To find the maximum speed, you’ll need to know the value of the amplitude of the vertical acceleration. The value of the amplitude, is equal to the maximum radial acceleration the pendulum will experience. The pendulum will only experience maximum radial acceleration when it is moving at its highest velocity. So we can estimate the maximum velocity using the amplitude and this equation:

───
或終於明白萊昂‧傅科之意旨的耶??!!
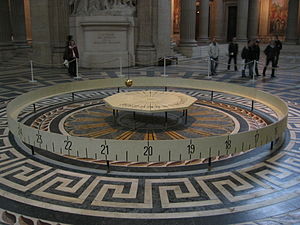
巴黎先賢祠傅科擺
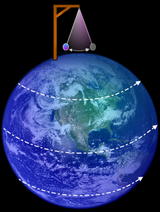
北極,角速度為零
北緯 30° 一周兩天
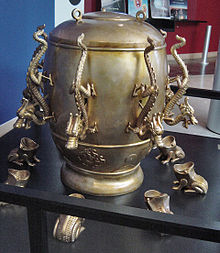
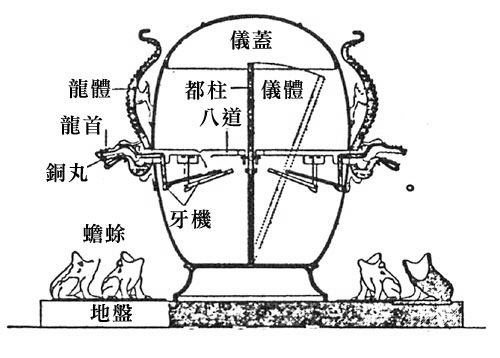
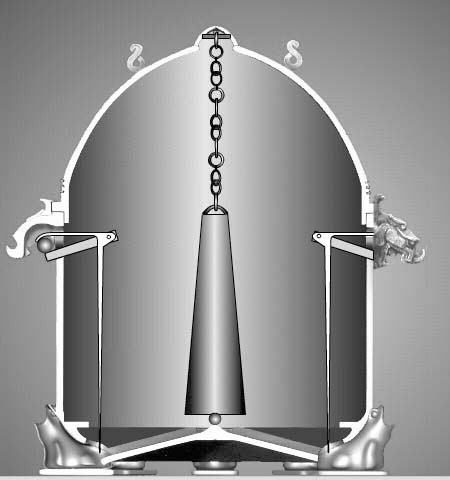
之前曾經談過『張衡』的『候風地動儀』為何失傳,它與漢代『讖緯之學』的關係,於此摘引『前因後果』的一小段
既然叫做『候風地動儀』,它的命名必然有些來歷。西漢末年隨著社會的衝突加劇,『讖緯之學』開始廣泛大流行。 《後漢書‧光武帝紀》光武帝於中元元年宣布『圖讖』於天下,把圖讖國教化。生於之後的張衡自當深知讖緯之術。就像『物候曆』的傳統,比如說《禮記‧月令》 更是其來有自。然後發展成用『占候』來『預測』人事的『吉凶禍福』。因此命名裡那個『候』字應是指『徵候』,藉著此徵候來『預測』之義。而『風』字當是 『風角』之術的觀『八方』風的用法,藉以表達『八個方位 』的意思。如此看來這個候風地動儀的名義就是『測知八方地動之器』。
……
自公元一三二年張衡發明候風地動儀以來,接連發生了幾次地震,到公元一三四年的隴西地震,張衡名氣大造,候風地動儀也聲名遠播。然而因著『天象』結合了『政爭』,頻起的『地震』 究竟是『誰的過錯』?懺緯之說如是說︰地震起於『用人不當』,此上天之所以『罰罪』。縱使張衡有『天才之能』亦『無力分說』那個『地震之是非』 。因此公元一三四年有『高官免職』後,張衡的『官運』也就步上了『黯淡之途』。由於沒有人希望能夠再『測出地震』,這時那個候風地動儀已經成為了『不祥之器』!短短幾年後,到了公元一三九年張衡抑鬱而逝。東漢末年,公元一九零年,董卓一把大火燒毀了『洛陽城』,一切終歸於『灰飛煙滅』!!
由此觀之,持守『科學精神』的『理性』實屬不易,『科技文明』的『發達』,也很難度杜絕『無根之言』,也許應該說面對『大自然』的『神奇奧妙』,人類其實『所知甚少』。而且一些雖然說是人們『已知之事』,但由於是『抽象』的,在缺乏了『直接經驗』下,總是顯得有些『難明難了』的吧!舉個例子來說,我們都知道『地球自轉』產生了太陽的『東升西落』,也學過牛頓力學所講的『慣性系統』,可是我們並不感覺地球在自轉的啊!一八五一年二月法國物理學家『萊昂‧傅科』Jean Bernard Léon Foucault 首度次在『巴黎天文台』的子午儀室公開展示了一的『單擺』。幾星期之後,傅科他又在『巴黎先賢祠』的拱頂下,用一根長六十七公尺的鋼索,其下懸掛了一顆重二十八公斤的鉛錘,然後使之擺動。這個單擺的『擺動平面』它每小時順時針方向旋轉 11° 度,經三十點七小時後環繞一圈。這就是大名鼎鼎的『傅科擺』 Foucault pendulum ,它的旋轉角速度  與『緯度』
與『緯度』  成正比,可以表示為
,此處,『北緯』角度為『正』,表示『順時針方向旋轉』。據聞一八五五年,這個單擺被移到了國立巴黎工藝技術學院之國立工藝博物館。然後在二零一零年四月六日,國立工藝博物館內懸掛鉛錘的鋼索不知何故斷裂,使得單擺和博物館的大理石地板都受到無法修補的損壞。或許自傅科擺第一次以簡單的實驗證明『地球自轉』以來,這個擺已經善盡了『告知大眾』的『義務』的吧!!
─── 引自《水的生命!!下》
 的一階導數大於零
  ;但隨著『財富』的增加,『滿足程度』的積累速度卻是不斷下降,正因為『效用函數』之二階導數小於零
  。
。
 ,能產生互斥『結果』
  的『彩票』
的『彩票』  表示成︰
表示成︰ 。
。 ,
, ,或
,或 
 』
』 ,而且
,而且  ,那麼
,那麼  。
。 , 那麼存在一個『機率』
![p\in[0,1]](http://www.freesandal.org/wp-content/ql-cache/quicklatex.com-cd99876237a78fec45ef2ec4cc909f44_l3.png "Rendered by QuickLaTeX.com") ,使得
,使得  。
。 與『機率』
與『機率』 ![p\in(0,1]](http://www.freesandal.org/wp-content/ql-cache/quicklatex.com-2de5bbe9671b75f59e6027e3063c85ec_l3.png "Rendered by QuickLaTeX.com") ,滿足
,滿足  。
。 ,使得
,使得  ,而且對任意兩張『彩票』,如果
  。此處
。此處  代表對
代表對  ,符合
,符合 。
。
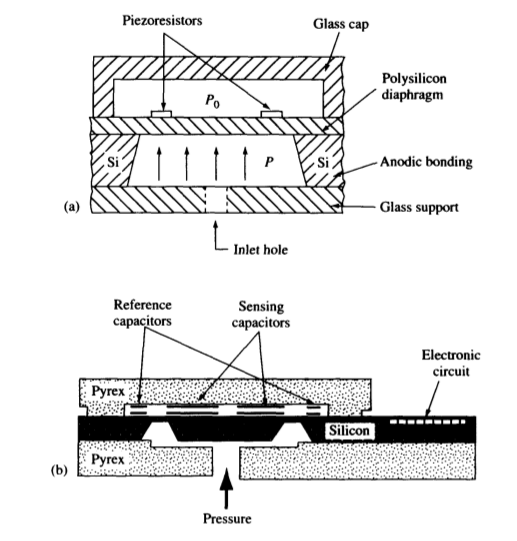
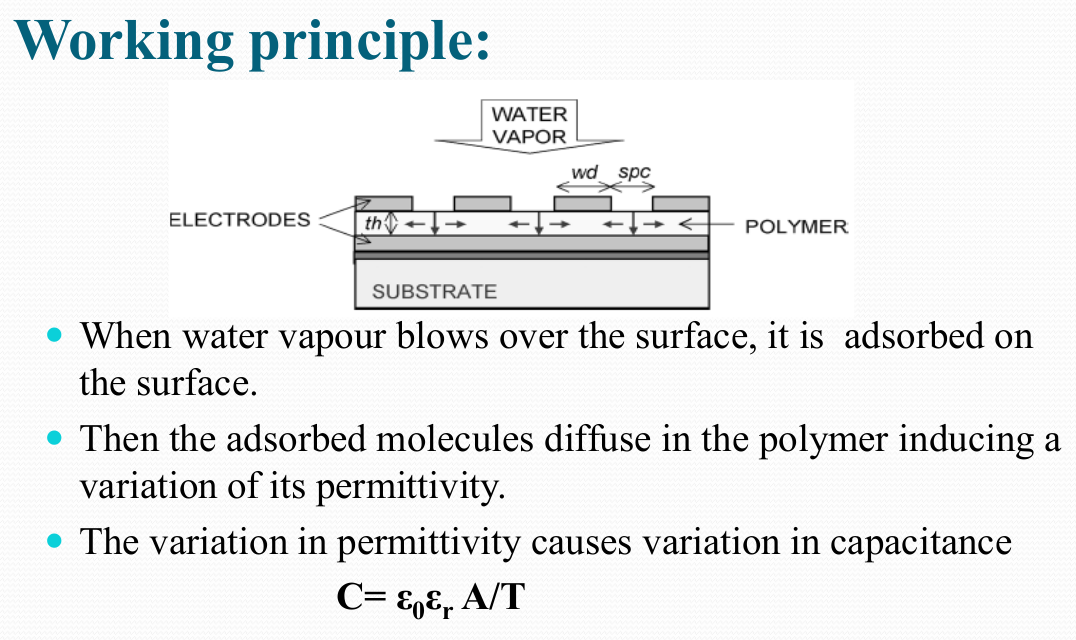
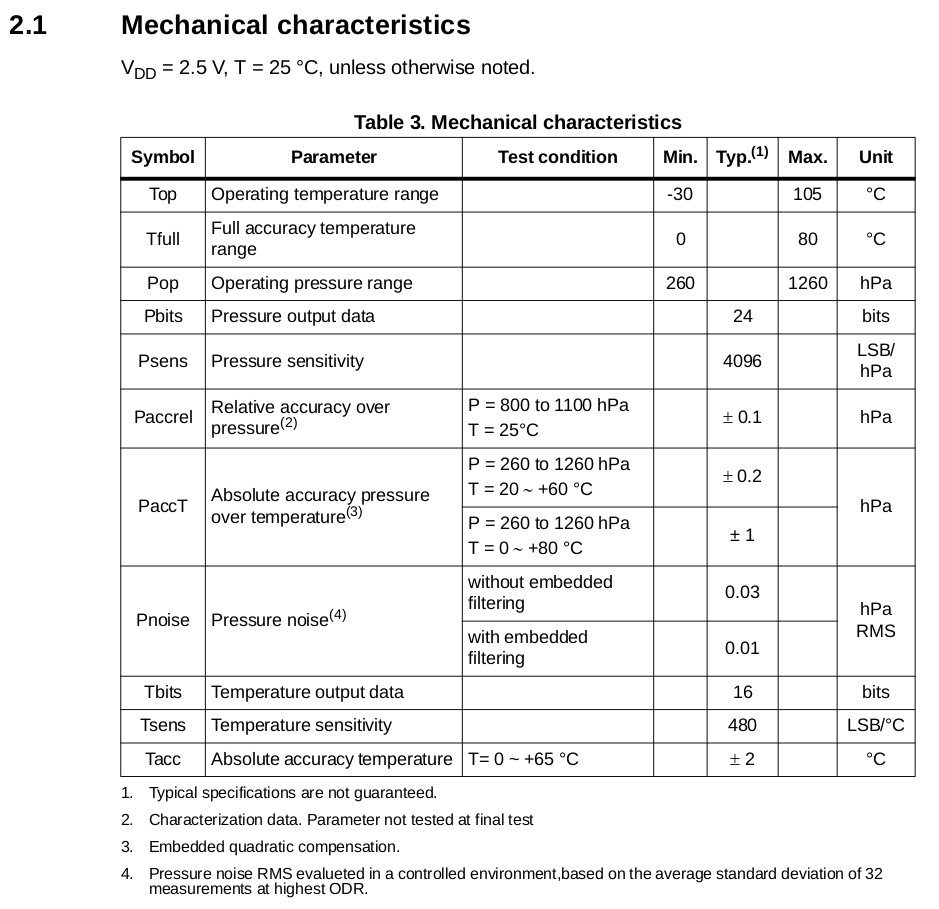
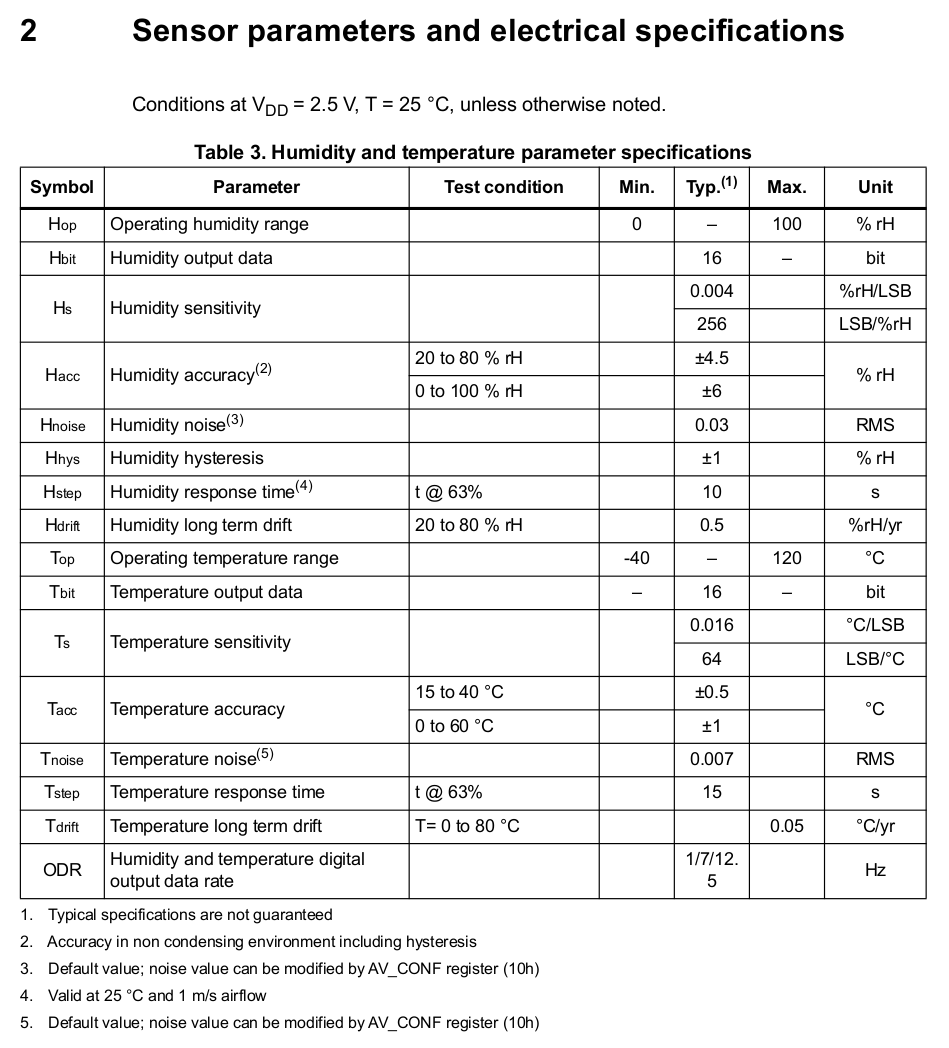
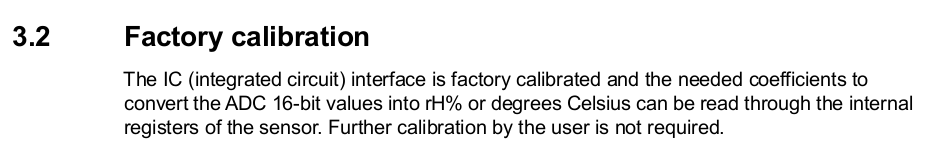
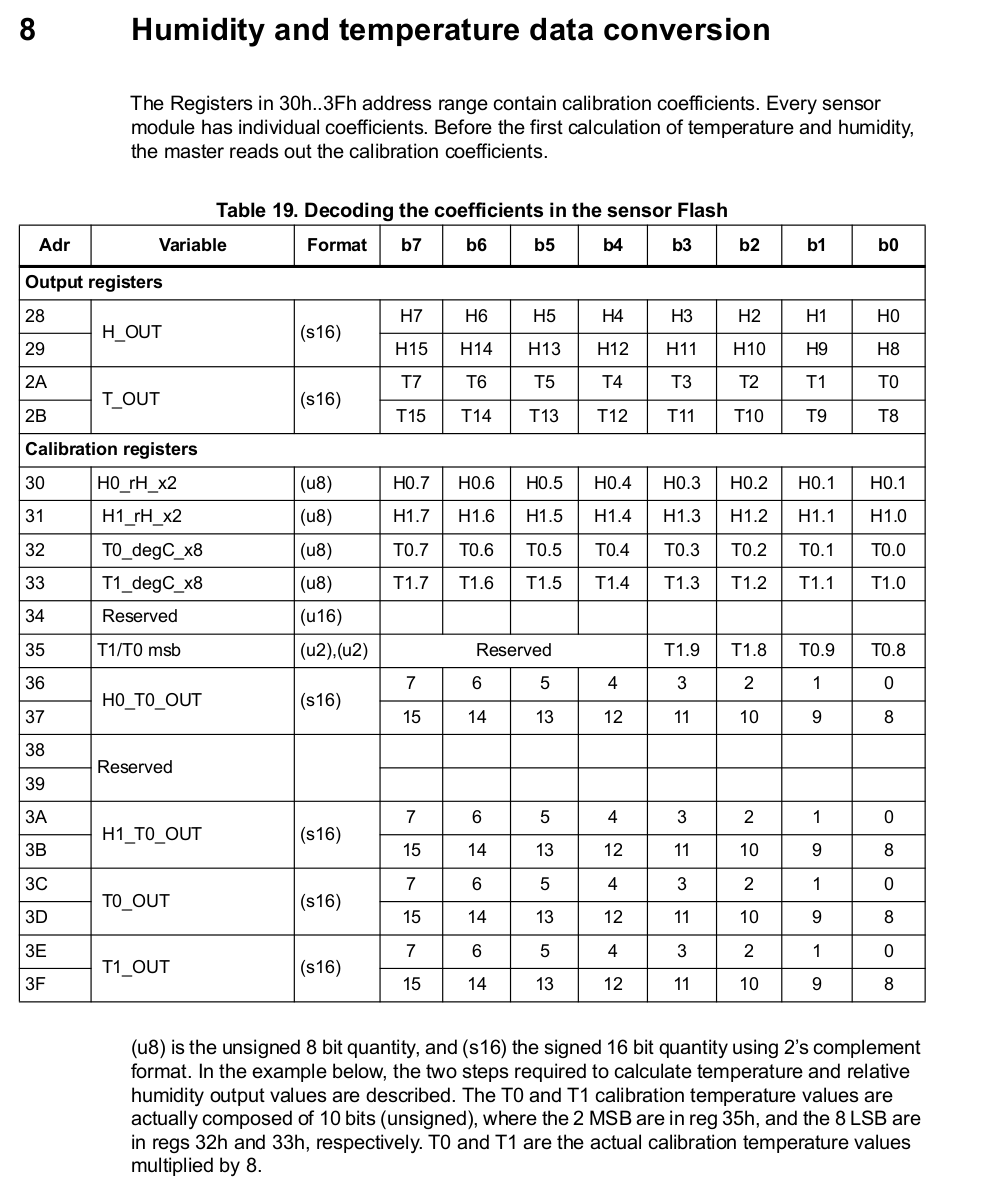
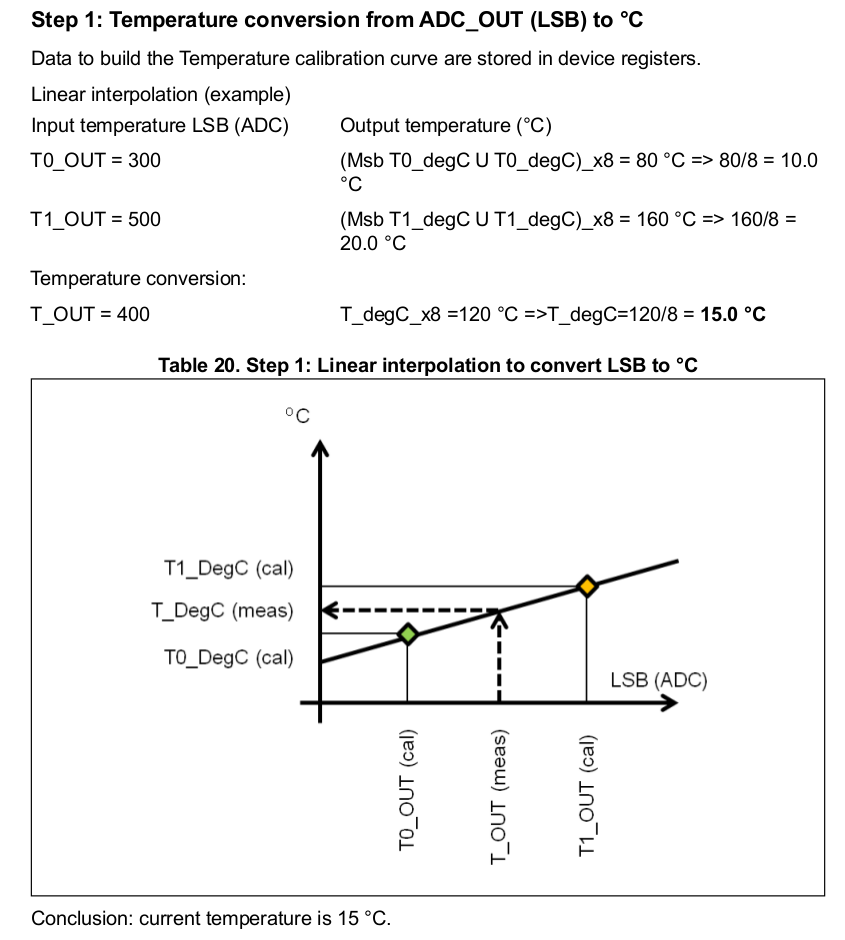
![sudo python3 Python 3.2.3 (default, Mar 1 2013, 11:53:50) [GCC 4.6.3] on linux2 Type "help", "copyright", "credits" or "license" for more information. >>> from sense_hat import SenseHat >>> 感測 = SenseHat() # 壓力計量溫度 >>> 溫度_壓力計 = 感測.get_temperature_from_pressure() >>> print("溫度: %s C" % 溫度_壓力計) 溫度: 30.652084350585938 C >>> 壓力 = 感測.get_pressure() >>> print("壓力: %s Millibars" % 壓力) 壓力: 1008.718994140625 Millibars # 溼度計量溫度 >>> 溫度_溼度計 = 感測.get_temperature_from_humidity() >>> print("溫度: %s C" % 溫度_溼度計) 溫度: 30.774192810058594 C >>> 溼度 = 感測.get_humidity() >>> print("溼度: %s %%rH" % 溼度) 溼度: 70.17244720458984 %rH >>> </pre> ─── <span style="color: #808000;">不知讀者是否已經有了答案的呢??僅就比較</span> <span style="color: #808080;">【壓力之溫度感測器】︰](http://www.freesandal.org/wp-content/ql-cache/quicklatex.com-ee6f66a3395e81d3c21737112c9f035e_l3.png "Rendered by QuickLaTeX.com") 0 - 65^{\circ} C \ \pm 2^{\circ} C
0 - 65^{\circ} C \ \pm 2^{\circ} C 0 - 60^{\circ} C \ \pm 1^{\circ} C
![</span> <span style="color: #808000;">準確度而言,這個『平均』的作法恐怕是無攸利的吧!或知在相對溼度的量測中,溫度是個重要的因子乎!!因此必須考慮它的影響 ,所以工廠的『校準』方才會有這麼大的一張表︰</span> <a href="http://www.freesandal.org/wp-content/uploads/Humidity-Temperature-data-conversion.png"><img class="alignnone size-full wp-image-42450" src="http://www.freesandal.org/wp-content/uploads/Humidity-Temperature-data-conversion.png" alt="Humidity-Temperature-data-conversion" width="988" height="1194" /></a> <span style="color: #808000;"> </span> <span style="color: #808000;">那麼什麼是『<a style="color: #808000;" href="https://zh.wikipedia.org/zh-tw/%E6%A0%A1%E5%87%86">校準</a>』 <a style="color: #808000;" href="https://en.wikipedia.org/wiki/Calibration">Calibration</a> 的呢?維基百科的詞條講︰</span> <b>Calibration</b> is process of finding a relationship between two unknown (when the measurable quantities are not given a particular value for the amount considered or found a standard for the quantity) quantities. When one of quantity is known, which is made or set with one device, another measurement is made as similar way as possible with the first device using a second device.The measurable quantities may differ in two devices which are equivalent. The device with the known or assigned correctness is called the <a title="Standard (metrology)" href="https://en.wikipedia.org/wiki/Standard_%28metrology%29">standard</a>. The second device is the <a title="Device under test" href="https://en.wikipedia.org/wiki/Device_under_test">unit under test</a>, test instrument, or any of several other names for the device being calibrated. The formal definition of calibration by the <a title="International Bureau of Weights and Measures" href="https://en.wikipedia.org/wiki/International_Bureau_of_Weights_and_Measures">International Bureau of Weights and Measures</a> is the following: "Operation that, under specified conditions, in a first step, establishes a relation between the quantity values with measurement uncertainties provided by measurement standards and corresponding indications with associated measurement uncertainties (of the calibrated instrument or secondary standard) and, in a second step, uses this information to establish a relation for obtaining a measurement result from an indication."<sup id="cite_ref-metrology_terms_1-0" class="reference"><a href="https://en.wikipedia.org/wiki/Calibration#cite_note-metrology_terms-1">[1]</a></sup> <a href="http://www.freesandal.org/wp-content/uploads/Avery_postal_scale.jpg"><img class="alignnone size-full wp-image-42493" src="http://www.freesandal.org/wp-content/uploads/Avery_postal_scale.jpg" alt="Avery_postal_scale" width="170" height="257" /></a> An example of a device whose calibration is off: a <a title="Weighing scale" href="https://en.wikipedia.org/wiki/Weighing_scale">weighing scale</a> that reads ½ ounce without any load. ─── <span style="color: #808000;">簡單的說就是︰選擇已知『精準度』的 □□ 物理量之量測儀器為『標準』,在相同的條件下,用其對此 □□ 物理量之『度量值』作『基礎』,建立其與『待校正設備』對這同一 □□ 物理量之 ○○ 『量測值』的『數值關係』。這個 ○○ 『量測值』就是由該設備之『量測方法』所決定的。比方說︰</span> <span style="color: #808000;">【壓力感測器用電阻】</span> <a href="http://www.freesandal.org/wp-content/uploads/基本壓力感測器構造.png"><img class="alignnone size-full wp-image-41373" src="http://www.freesandal.org/wp-content/uploads/基本壓力感測器構造.png" alt="基本壓力感測器構造" width="517" height="541" /></a> <span style="color: #808000;">【溼度感測器用電容】</span> <a href="http://www.freesandal.org/wp-content/uploads/溼度感測器工作原理.png"><img class="alignnone size-full wp-image-41984" src="http://www.freesandal.org/wp-content/uploads/溼度感測器工作原理.png" alt="溼度感測器工作原理" width="1076" height="640" /></a> <span style="color: #808000;">若是 □□ 物理量與 ○○ 物理量之間是『線性關係』</span>](http://www.freesandal.org/wp-content/ql-cache/quicklatex.com-d38b0c5d64a3f13e24f2375078be3f10_l3.png "Rendered by QuickLaTeX.com") \Box = \alpha \cdot \bigcirc + \beta
\Box = \alpha \cdot \bigcirc + \beta \sigma_{\Box} = \alpha \cdot \sigma_{\bigcirc}
 python3
Python 3.4.2 (default, Oct 19 2014, 13:31:11)
[GCC 4.9.1] on linux
Type "help", "copyright", "credits" or "license" for more information.
>>> from sense_hat import SenseHat
>>> 感測 = SenseHat()
>>> 溫度 = 感測.get_temperature()
>>> 壓力 = 感測.get_pressure()
>>> 溼度 = 感測.get_humidity()
>>> 溫度 = round(溫度, 1)
>>> 壓力 = round(壓力, 1)
>>> 溼度 = round(溼度, 1)
>>> print(溫度, 壓力, 溼度)
27.9 1017.3 67.5
>>>
python3
Python 3.4.2 (default, Oct 19 2014, 13:31:11)
[GCC 4.9.1] on linux
Type "help", "copyright", "credits" or "license" for more information.
>>> from sense_hat import SenseHat
>>> 感測 = SenseHat()
>>> 溫度 = 感測.get_temperature()
>>> 壓力 = 感測.get_pressure()
>>> 溼度 = 感測.get_humidity()
>>> 溫度 = round(溫度, 1)
>>> 壓力 = round(壓力, 1)
>>> 溼度 = round(溼度, 1)
>>> print(溫度, 壓力, 溼度)
27.9 1017.3 67.5
>>>


 ,
, ,
, 稱為
稱為 