想像如果有一天未來的人類必須由僅存的『古代文獻』?
CIE XYZ色彩空間定義
實驗結果— CIE RGB色彩空間
CIE RGB色彩空間是RGB色彩空間之一,以單色(單一波長)原色的特定集合著稱。
在1920年代,W. David Wright(Wright 1928)和John Guild(Guild 1931)獨立進行了一系列人類視覺實驗,提供了CIE XYZ色彩空間規定的基礎。
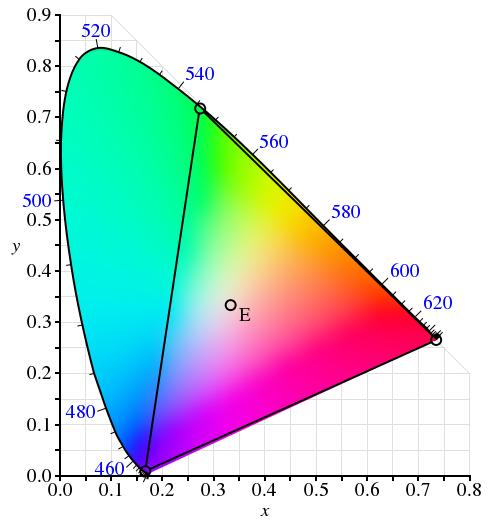
CIE RGB原色的色域和原色在CIE 1931 xy色度圖上的位置。
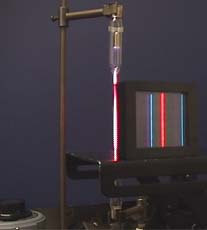
實驗使用2度視角的圓形螢幕。螢幕的一半投影上測試顏色,另一半投影上觀察者可調整的顏色。可調整的顏色是三種原色的混合,它們每個都有固定的色度,但有可調整的明度。
觀察者改變三種原色光的明度直到觀察到混合的顏色匹配了測試顏色。不是所有顏色都可使用這種技術匹配。當沒有匹配的時候,可變數量的一種原色被增加 到測試顏色上,用餘下兩種原色混合與它匹配。對於這種情況,增加到測試顏色上原色的數量被認為是負值。通過這種方式,可以覆蓋完整的人類顏色感知。當測試 顏色是單色的時候,可以把使用的每種原色的數量繪製為測試顏色的波長的函數。這三個函數叫做這個特定實驗的「顏色匹配函數」。
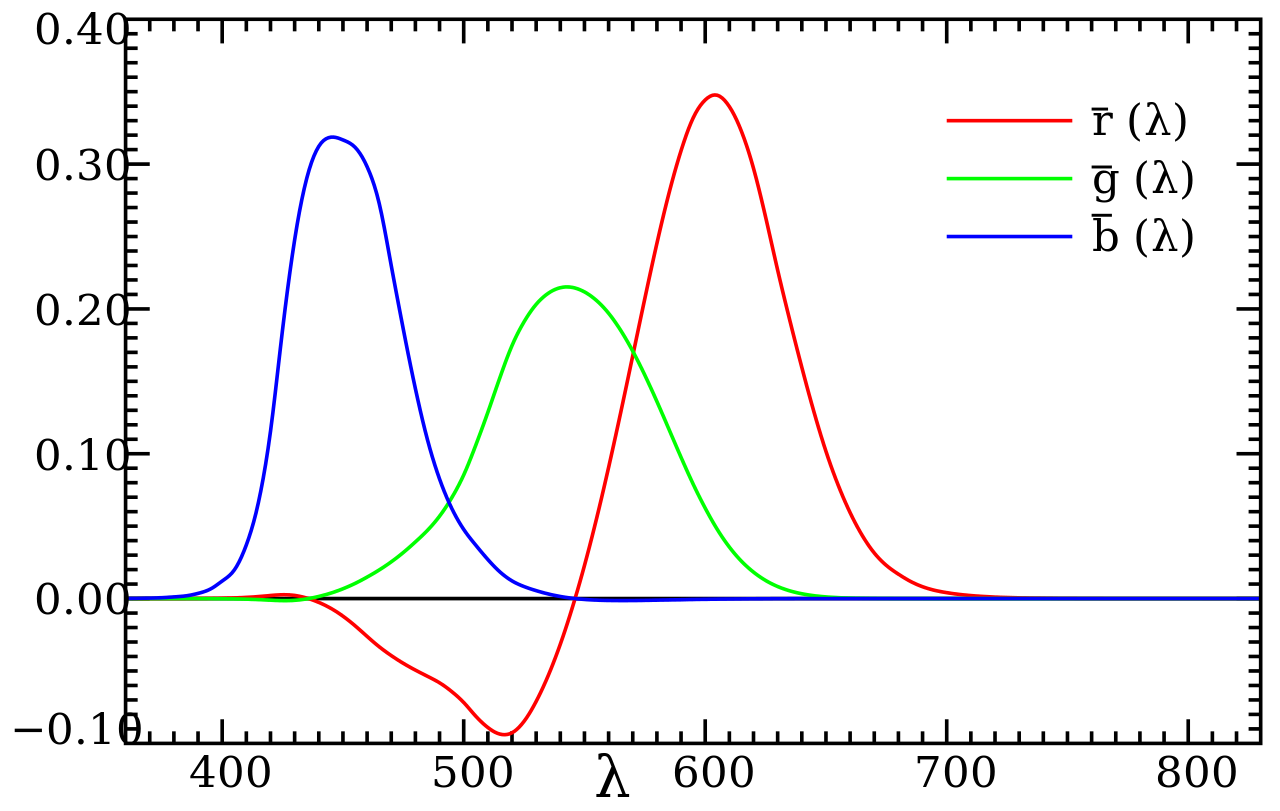
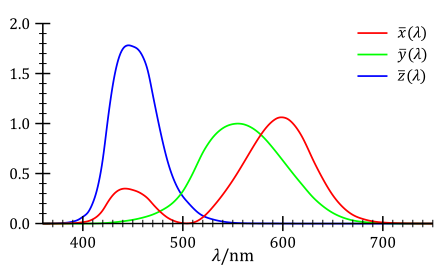
CIE 1931 RGB顏色匹配函數。顏色匹配函數是匹配水平刻度標示的波長的單色測試顏色所需要的原色數量。
儘管Wright和Guild的實驗使用了各種強度的各種原色,和一些不同的觀察者,所有他們的結果都被總結為標準CIE RGB顏色匹配函數 


經過CIE的特別委員會的深思熟慮之後確定了顏色匹配函數和原色(Fairman 1997)。在圖的短波和長波的側的取捨點某種程度上是隨意選擇的;人類眼睛實際上能看到波長直到810 nm的光,但是敏感度要數千倍低於綠色光。定義的這些顏色匹配函數叫做「1931 CIE標準觀察者」。注意勝過指定每種原色的明度,這種曲線通常規範化為在其下有固定的面積。這個面積按如下規定而固定為特定值

結果的規範化顏色匹配函數經常對源照度按r:g:b比率1:4.5907:0.0601縮放、和為源輻射功率按比率72.0962:1.3791:1縮放來重新生成真正的顏色匹配函數。通過提議標準化原色,CIE建立了客觀顏色表示法的一個國際系統。
給定這些縮放了顏色匹配函數,帶有頻譜功率分布 


這些都是內積,並可以被認為是無限維頻譜到三維顏色的投影。
格拉斯曼定律
你可能會問:「為什麼可以使用不同原色和它們的不同實際使用強度來總結Wright和Guild的結果?」還可能問:「要匹配的測試顏色不是單色會怎樣?」。對這兩個問題的答案在於人類色彩感知的(幾乎)線性。這種線性被表達為格拉斯曼定律。
CIE RGB空間可以被用來以常規方式定義色度:色度坐標是r和g:


從Wright–Guild數據構造CIE XYZ色彩空間
在使用CIE RGB顏色匹配函數開發了人類視覺的RGB模型之後,特殊委員會的成員希望開發出與CIE RGB色彩空間有關的另一個色彩空間。它假定Grassmann定律成立,這個新空間通過線性變換而有關於CIE RGB空間。新空間將以三個新顏色匹配函數來定義: 


選擇這個新色彩空間是因為它有如下性質:
- 新顏色匹配函數在所有地方都大於等於零。在1931年,計算是憑藉手工或滑尺進行的,正值的規定有用於計算簡化。
-
- 對於恆定能量白點,要求為x = y = z = 1/3。
- 由於色度定義和要求x和y為正值的優勢,可以在三角形[1,0],[0,0],[0,1]內見到所有顏色的色域。在實踐中必須把色域完全的充入這個空間中。
-
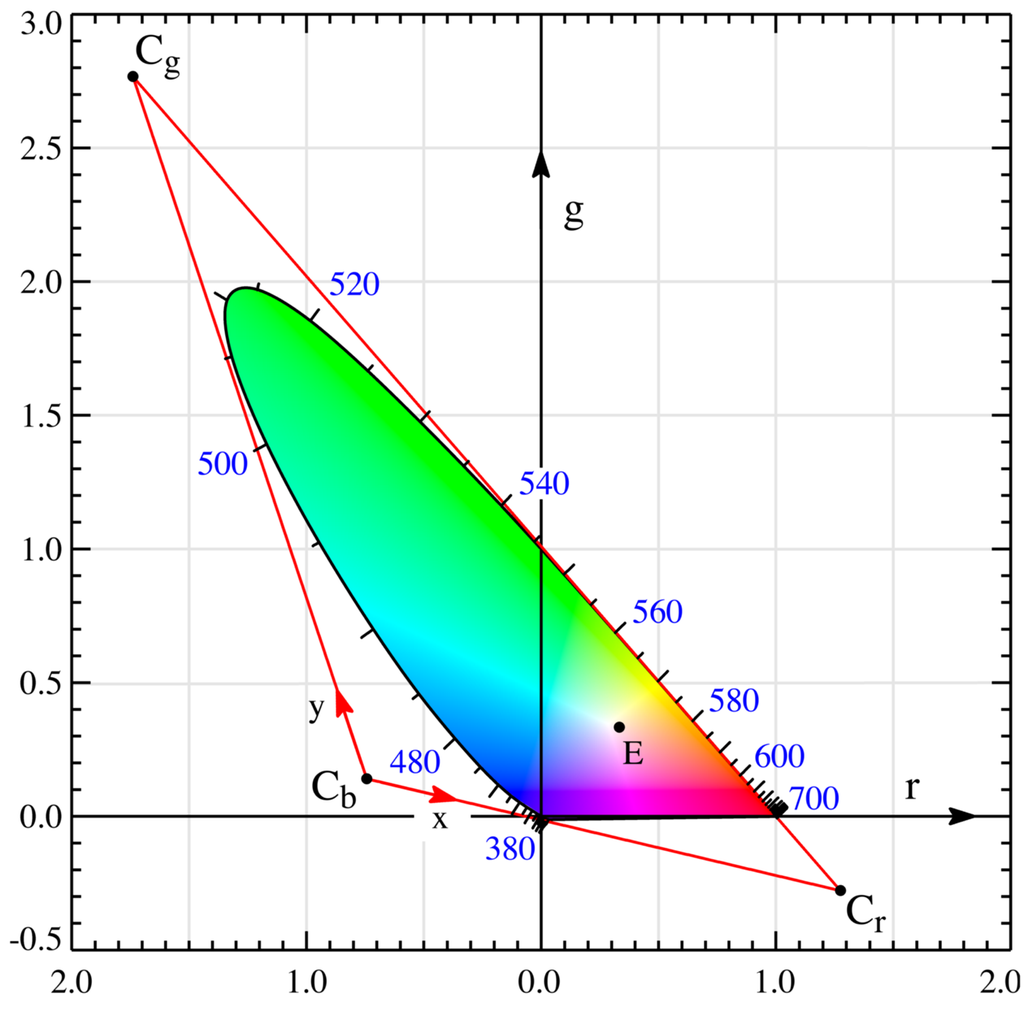
在CIE rg色度圖中展示規定CIE XYZ色彩空間的三角形構造。三角形Cb-Cg-Cr就是在CIE xy色度空間中的xy=(0,0),(0,1),(1,0)三角形。連接Cb和Cr的直線是alychne。注意光譜軌跡通過rg=(0,0)於435.8 nm,通過rg=(0,1)於546.1 nm,通過rg=(1,0)於700 nm。還有,均等能量點(E)位於rg=xy=(1/3,1/3)。
用幾何術語說,選擇新色彩空間等於在rg色度空間中選擇一個新三角形。在右側的圖形中,rg色度坐標展示在兩個黑色軸上,還有1931標準觀察者的色域。展示為上述要求所確定的是紅色CIE xy色度軸。要求XYZ坐標非負意味著Cr, Cg, Cb形成的三角形必須包圍標準觀察者的整個色域。連接Cr和Cb的直線由
 在380 nm到780 nm之間的(間隔5 nm)CIE 1931標準色度觀察者XYZ函數

要求3確定了XYZ顏色匹配函數的積分必須相等,可通過要求2確定的適應光發光效率函數的積分得到它。必須注意到制表的敏感度曲線有一定量的任意性在其中。單獨的X、Y和Z敏感度曲線可以按合理的精度測量。但是整體的光度曲線(它事實上是這個三個曲線的加權和)是主觀的,因為它涉及到問測試人兩個光源是否有同樣的明度,即使它們是完全不同的顏色。同樣的,X、Y和Z的曲線的相對大小(magnitude)也是任意的。你也可以定義有兩倍幅值的X敏感度曲線的有效色彩空間。這個新色彩空間將有不同的形狀。CIE 1931和1964 XYZ色彩空間的敏感度曲線被縮放為有相同的曲線下面積。
重新建構今人『色彩空間』,方能破解新發掘之重要的圖像檔! !他們會怎麼作呢??
這個『無厘頭』的『問題』,果真是『無所說』乎??!!
若說『來者強於逝者』,當已能用『軟體模擬』及『數字實驗』耶!!??
故而只需靠『此刻假設』、『那時驗證』法,即可得其『真實』吧◎
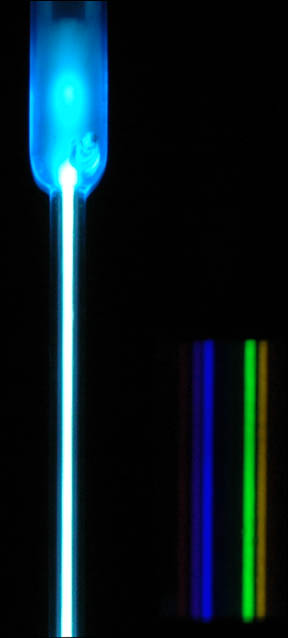
Atomic Spectra
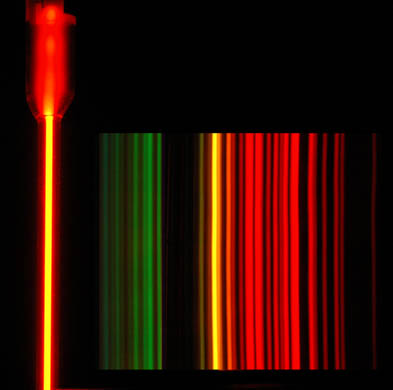
This is an attempt to give a reasonable accurate picture of the appearance of the neon spectrum, but both the images are composite images. The image below is composed of segments of three photographs to make the yellow and green lines more visible along with the much brighter red lines. Then the image below was reduced and superimposed on the image above, because with the exposure reasonable for the bright tube, only the red lines were visible on the photograph. 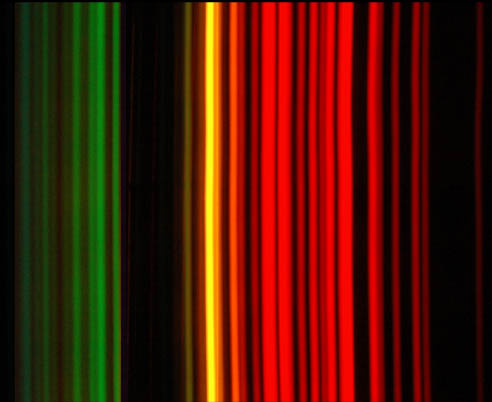
 |
Index | ||||||||||||||||||||||||||||||||||||||||||||||||||||
|
Go Back |


Atomic Spectra
|
Index
Reference |
|||||||||||||||||||||
|
Go Back |

Diffraction grating
In optics, a diffraction grating is an optical component with a periodic structure, which splits and diffracts light into several beams travelling in different directions. The emerging coloration is a form of structural coloration.[1][2] The directions of these beams depend on the spacing of the grating and the wavelength of the light so that the grating acts as the dispersive element. Because of this, gratings are commonly used in monochromators and spectrometers.
For practical applications, gratings generally have ridges or rulings on their surface rather than dark lines. Such gratings can be either transmissive or reflective. Gratings which modulate the phase rather than the amplitude of the incident light are also produced, frequently using holography.[3]
The principles of diffraction gratings were discovered by James Gregory, about a year after Newton’s prism experiments, initially with items such as bird feathers.[4] The first man-made diffraction grating was made around 1785 by Philadelphia inventor David Rittenhouse, who strung hairs between two finely threaded screws.[5] This was similar to notable German physicist Joseph von Fraunhofer‘s wire diffraction grating in 1821.[6]
Diffraction can create “rainbow” colors when illuminated by a wide spectrum (e.g., continuous) light source. The sparkling effects from the closely spaced narrow tracks on optical storage disks such as CDs or DVDs are an example, while the similar rainbow effects caused by thin layers of oil (or gasoline, etc.) on water are not caused by a grating, but rather by interference effects in reflections from the closely spaced transmissive layers (see Examples, below). A grating has parallel lines, while a CD has a spiral of finely-spaced data tracks. Diffraction colors also appear when one looks at a bright point source through a translucent fine-pitch umbrella-fabric covering. Decorative patterned plastic films based on reflective grating patches are very inexpensive, and are commonplace.
![]()
An incandescent light bulb viewed through a transmissive diffraction grating.[dubious ]
Diffraction GratingWhen there is a need to separate light of different wavelengths with high resolution, then a diffraction grating is most often the tool of choice. This “super prism” aspect of the diffraction grating leads to application for measuring atomic spectra in both laboratory instruments and telescopes. A large number of parallel, closely spaced slits constitutes a diffraction grating. The condition for maximum intensity is the same as that for the double slit or multiple slits, but with a large number of slits the intensity maximum is very sharp and narrow, providing the high resolution for spectroscopic applications. The peak intensities are also much higher for the grating than for the double slit.
|
Index | |||||
|
Go Back |
Diffraction Grating
|
Index | ||||||||
|
Go Back |