雖說現今對人類能力的認識,早有
多元智能理論
加德納認為過去對智力的定義過於狹窄,未能正確反映一個人的真實能力。他認為,人的智力應該是一個量度他的解題能力(ability to solve problems)的指標。根據這個定義,他在《心智的架構》(Frames of Mind, Gardner, 1983)這本書裡提出,人類的智能至少可以分成七個範疇(後來增加至八個):
- 語文(Verbal/Linguistic)
- 邏輯數學(Logical/Mathematical)
- 空間(Visual/Spatial)
- 肢體動覺(Bodily/Kinesthetic)
- 音樂(Musical/Rhythmic)
- 人際(Inter-personal/Social)
- 內省 (Intra-personal/Introspective)
- 自然觀察(Naturalist,加德納在1999年補充)
另外,有其他學者從內省智能分拆出「靈性智能」(spiritual intelligence)。
。然而在教育上
智力商數(德語:Intelligenz Quotient),簡稱智商(德語:IQ),是用標準測試測量人在其年齡段的認知能力(「智力」)的得分。人的智商呈常態分布,,目前主流的智力測驗(包含最常被使用的「魏氏智力測驗」),都採用「離差智商」(deviant IQ scores)的定義。亦即,個體的IQ分數,會和個體所屬的常模(例如:和相同年齡、國家的人們)相比較。這個常模的IQ分數的平均值為100分,標準差為15分。即68.2%的人的智商在85-115之間,即95.4%的人的智商在70-130之間, 即99.6%的人的智商在55-145之間。
最新的研究表明,智商有可能不單是與遺傳因素有關,例如智商降低或和精神分裂症風險基因直接相關,還與生活環境有關。即智商的高低可能與遺傳因素和生活環境有關,例如純母乳餵養六個月以上的嬰兒智商較配方奶餵養的嬰兒高約7點[1],飲食缺乏碘則會造成兒童智商下降約12點,許多第三世界國家在消除缺碘和缺微量元素的環境後,民眾智商會急劇增加。
「比率智商(ratio IQ scores)」計算公式: ,
,
不過需要注意,上述的智商計算公式─比率智商(ratio IQ scores),已經普遍被當代的心理學界與教育學界拋棄。
現代人平均智商在逐漸增加,被稱為弗林效應,但不了解其原因是智力實際增長還是因為測量的原因所導致。
瑞文氏標準推理測驗的試題
依舊是最重要的數值指標。於是『因才施教』的理念,在這個資訊發達的時代也無法落實。或許人們需要更清楚的認識『智商』 IQ 這根尺所『度量』的事物到底是什麼?若講眼、耳、鼻、舌、身、意六識,人人各有利、鈍。假設以六種不同『測試』來度量人,難道 IQ 高者,眼力就能查秋毫之末?耳力也可聞天籟之音??或許不必假借實測,人們也不會認為真有這樣的事吧!就算有人六根皆利,而且 IQ 極高,名之『超人』,亦又如之何哉!偶然的事若發生總該有必然的理居其間的吧!!
因此任一『系統』  ,用著某一『尺度』
  來『量測』。我們不單要了解那個『量測尺度』
Level of measurement
Level of measurement or scale of measure is a classification that describes the nature of information within the numbers assigned to variables.[1] The best known classification is that developed by the psychologist Stanley Smith Stevens, who proposed four levels, or scales, of measurement: nominal, ordinal, interval, and ratio.[1][2] Other classifications include those by Chrisman[3] and by Mosteller and Tukey.[4] This framework of distinguishing levels of measurement originated in psychology and is widely criticized by scholars in other disciplines.[5]
Stevens’s typology
Overview
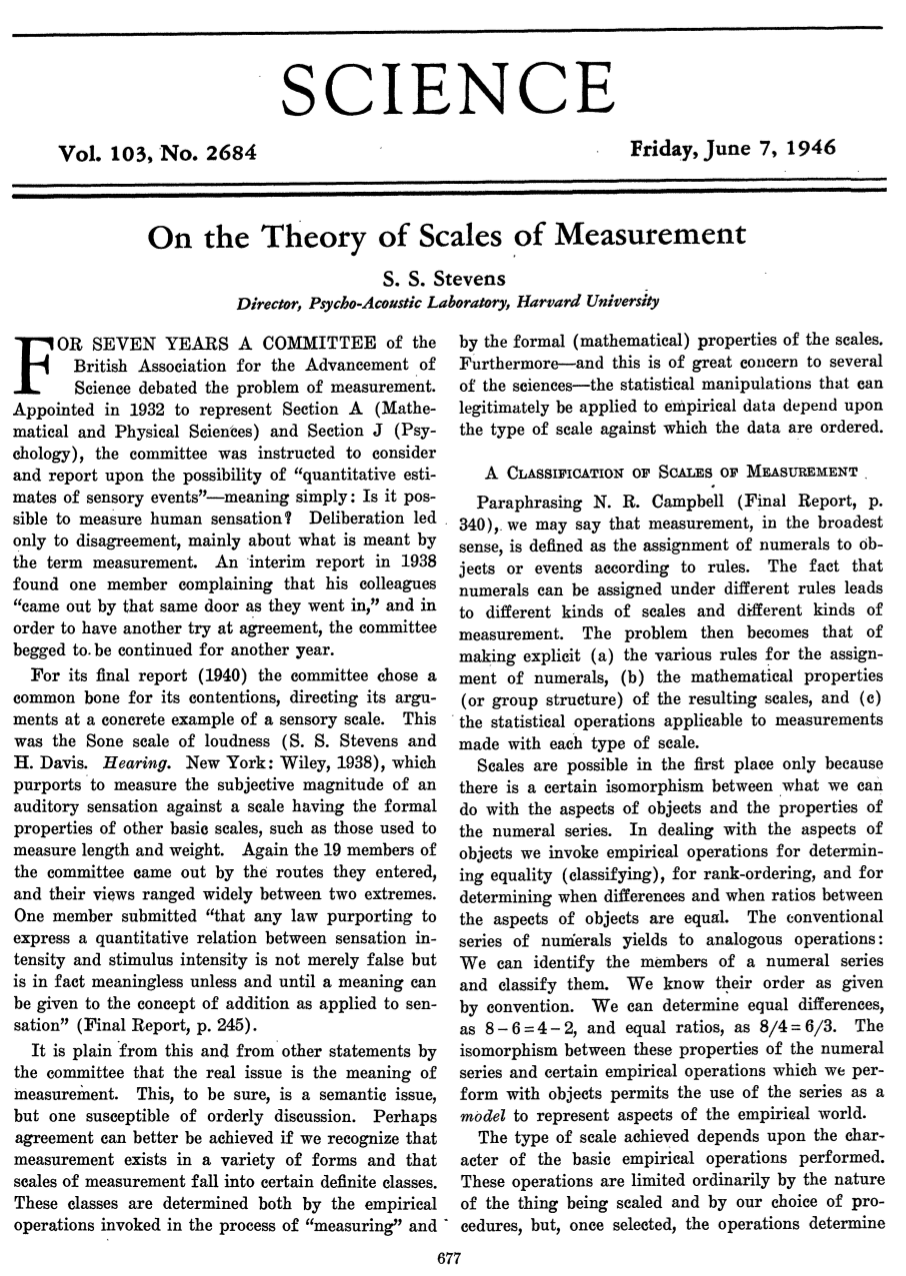
Stevens proposed his typology in a 1946 Science article titled “On the theory of scales of measurement”.[2] In that article, Stevens claimed that all measurement in science was conducted using four different types of scales that he called “nominal,” “ordinal,” “interval,” and “ratio,” unifying both “qualitative” (which are described by his “nominal” type) and “quantitative” (to a different degree, all the rest of his scales). The concept of scale types later received the mathematical rigour that it lacked at its inception with the work of mathematical psychologists Theodore Alper (1985, 1987), Louis Narens (1981a, b), and R. Duncan Luce (1986, 1987, 2001). As Luce (1997, p. 395) wrote:
S. S. Stevens (1946, 1951, 1975) claimed that what counted was having an interval or ratio scale. Subsequent research has given meaning to this assertion, but given his attempts to invoke scale type ideas it is doubtful if he understood it himself … no measurement theorist I know accepts Stevens’s broad definition of measurement … in our view, the only sensible meaning for ‘rule’ is empirically testable laws about the attribute.
Nominal level
The nominal type differentiates between items or subjects based only on their names or (meta-)categories and other qualitative classifications they belong to; thus dichotomous data involves the construction of classifications as well as the classification of items. Discovery of an exception to a classification can be viewed as progress. Numbers may be used to represent the variables but the numbers do not have numerical value or relationship.
Examples of these classifications include gender, nationality, ethnicity, language, genre, style, biological species, and form.[6][7] In a university one could also use hall of affiliation as an example. Other concrete examples are
- in grammar, the parts of speech: noun, verb, preposition, article, pronoun, etc.
- in politics, power projection: hard power, soft power, etc.
- in biology, the taxonomic ranks below domains: Archaea, Bacteria, and Eukarya
Nominal scales were often called qualitative scales, and measurements made on qualitative scales were called qualitative data. However, the rise of qualitative research has made this usage confusing.
Mathematical operations
Set membership, classification, categorical equality, and equivalence are all operations which apply to objects of the nominal type.
Central tendency
The mode, i.e. the most common item, is allowed as the measure of central tendency for the nominal type. On the other hand, the median, i.e. the middle-ranked item, makes no sense for the nominal type of data since ranking is meaningless for the nominal type.[8]
Ordinal scale
The ordinal type allows for rank order (1st, 2nd, 3rd, etc.) by which data can be sorted, but still does not allow for relative degree of difference between them. Examples include, on one hand, dichotomous data with dichotomous (or dichotomized) values such as ‘sick’ vs. ‘healthy’ when measuring health, ‘guilty’ vs. ‘innocent’ when making judgments in courts, ‘wrong/false’ vs. ‘right/true’ when measuring truth value, and, on the other hand, non-dichotomous data consisting of a spectrum of values, such as ‘completely agree’, ‘mostly agree’, ‘mostly disagree’, ‘completely disagree’ when measuring opinion.
- Central tendency
The median, i.e. middle-ranked, item is allowed as the measure of central tendency; however, the mean (or average) as the measure of central tendency is not allowed. The mode is allowed.
In 1946, Stevens observed that psychological measurement, such as measurement of opinions, usually operates on ordinal scales; thus means and standard deviations have no validity, but they can be used to get ideas for how to improve operationalization of variables used in questionnaires. Most psychological data collected by psychometric instruments and tests, measuring cognitive and other abilities, are ordinal, although some theoreticians have argued they can be treated as interval or ratio scales. However, there is little prima facie evidence to suggest that such attributes are anything more than ordinal (Cliff, 1996; Cliff & Keats, 2003; Michell, 2008).[9] In particular,[10] IQ scores reflect an ordinal scale, in which all scores are meaningful for comparison only.[11][12][13] There is no absolute zero, and a 10-point difference may carry different meanings at different points of the scale.[14][15]
Interval scale
The interval type allows for the degree of difference between items, but not the ratio between them. Examples include temperature with the Celsius scale, which has two defined points (the freezing and boiling point of water at specific conditions) and then separated into 100 intervals, date when measured from an arbitrary epoch (such as AD), percentage such as a percentage return on a stock,[16] and direction measured in degrees from true or magnetic north. Ratios are not allowed since 20 °C cannot be said to be “twice as hot” as 10 °C, nor can multiplication/division be carried out between any two dates directly. However, ratios of differences can be expressed; for example, one difference can be twice another. Interval type variables are sometimes also called “scaled variables”, but the formal mathematical term is an affine space (in this case an affine line).
Central tendency and statistical dispersion
The mode, median, and arithmetic mean are allowed to measure central tendency of interval variables, while measures of statistical dispersion include range and standard deviation. Since one can only divide by differences, one cannot define measures that require some ratios, such as the coefficient of variation. More subtly, while one can define moments about the origin, only central moments are meaningful, since the choice of origin is arbitrary. One can define standardized moments, since ratios of differences are meaningful, but one cannot define the coefficient of variation, since the mean is a moment about the origin, unlike the standard deviation, which is (the square root of) a central moment.
Ratio scale
The ratio type takes its name from the fact that measurement is the estimation of the ratio between a magnitude of a continuous quantity and a unit magnitude of the same kind (Michell, 1997, 1999). A ratio scale possesses a meaningful (unique and non-arbitrary) zero value. Most measurement in the physical sciences and engineering is done on ratio scales. Examples include mass, length, duration, plane angle, energy and electric charge. Ratios are allowed because having a non-arbitrary zero point makes it meaningful to say, for example, that one object has “twice the length” of another (= is “twice as long”). Very informally, many ratio scales can be described as specifying “how much” of something (i.e. an amount or magnitude) or “how many” (a count). The Kelvin temperature scale is a ratio scale because it has a unique, non-arbitrary zero point called absolute zero.
- Central tendency and statistical dispersion
The geometric mean and the harmonic mean are allowed to measure the central tendency, in addition to the mode, median, and arithmetic mean. The studentized range and the coefficient of variation are allowed to measure statistical dispersion. All statistical measures are allowed because all necessary mathematical operations are defined for the ratio scale.
………
,更需思辨這個 系統的『性能』可以僅用那一根 尺來窮究的嗎?!假使換一根  的尺又將如何『比較』呢!?也許這一切還得回到 Stanley Smith Stevens 先生的
On the Theory of Scales of Measurement
文本之原點。
………
又豈該不審慎探究『期望效用函數理論』 Expected Utility Theory 所帶來的歷史教訓︰
它在『微觀經濟學』、『博弈論』與『決策論』中,今天稱之為『預期效用假說』 Expected utility hypothesis,指在有『風險』的情況下,任何『個體』所應該作出的『理性選擇』就是追求『效用期望值』的『最大化』。假使人生中的『抉擇』真實能夠如是的『簡化』,也許想得到『快樂』與『幸福』的辦法,就清楚明白的多了。然而有人認為這個『假說』不合邏輯。一九五二年,法國總體經濟學家莫里斯‧菲力‧夏爾‧阿萊斯 Maurice Félix Charles Allais ── 一九八八年,諾貝爾經濟學獎的得主 ── 作了一個著名的實驗,看看實際上人到底是怎麼『做選擇』的,這個『阿萊斯』發明的『彩票選擇實驗』就是大名鼎鼎的『阿萊斯悖論』 Allais paradox 。
針對百人測試所設計的『彩票』:
彩票甲:百分之百的機會得到一百萬元。【期望值 100 萬】
彩票乙:百分之十的機會得到五百萬元,百分之八十九的機會得到一百萬元,百分之一的機會什麼也得不到。【期望值 139 萬】
實驗結果:絕大多數人選擇甲而非乙。
然後改用另一組『彩票』,對同一群人繼續進行測試︰
彩票丙:百分之十一的機會得到一百萬元,百分之八十九的機會什麼也得不到。【期望值 11 萬】
彩票丁:百分之十的機會得到五百萬元,百分之九十的機會什麼也得不到。【期望值 50 萬】
實驗結果:絕大多數人選擇丁而非丙。
那麼這又是為什麼呢?也許說設想『人只是理性的』的這種想法,並不符合『合理性』,畢竟『人的心理』是『複雜的』,而且『人類行為』也是『多樣的』。於是自一九七九年起,以色列裔美國心理學家丹尼爾‧卡內曼 Daniel Kahneman 和以色列著名認知心理學者阿摩司‧特沃斯基 Amos Tversky 系統的研究『行為經濟學』 behavioral economic theory 這一領域,開創了現今稱為的『展望理論』prospect theory,試圖回答『為什麼』人是這麼『做選擇』的,此『前景理論』這麼講︰
People make decisions based on the potential value of losses and gains rather than the final outcome, and that people evaluate these losses and gains using certain heuristics.
這一個『描述性』理論認為,每個人基於自身所處之『參考點』之『不同』,面對『風險』就會有不同的『態度』。他們假設一個人的『得失衡量』可以表示成︰

,此處  是各個可能結果,而
  是『價值函數』 value function ,表示不同可能結果,在決策者心中的『相對價值』。而
  是『機會權重函數』 probability weighting function ,藉此表現通常人對於『極不可能』發生的事,往往會『過度反應』 over-react,而對『高度可能』出現的事,常常又會『反應不及』 under-react。從而形成一條穿過『參考點』的『S 型曲線』。那個
  就是一個人在作『得失決策』時的『總體評估』,或者說『預期效用』。
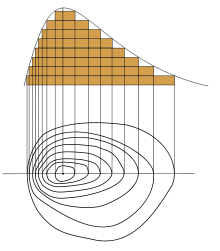
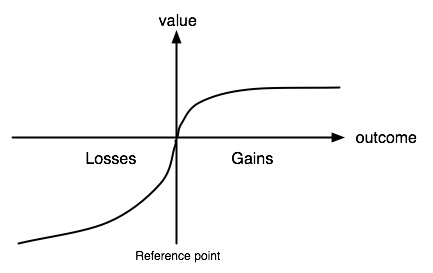
價值函數 value function
這條『S 型曲線』的不對稱性呈現出,當人們面對一個『損失』的『結果』,所產生之『厭惡感』或者說『傷感情』,比『獲益』之『情況』下所生的『滿意度』也許講『感覺好』,更為『強烈』。這使『展望理論』基本上不同於『期望效用函數理論』。有人將此理論的引申結論,整理成︰
確定效應:處於穫益狀態時,多數人是風險厭惡者。
反射效應:處於損失狀態時,多數人是風險喜好者。
損失規避:多數人對損失比對穫益敏感。
參照依賴:多數人對得失的判斷往往由參照點決定。
── 『人的行為』應當用著『純理性』來『定義』嗎?
還是應該要講『有人情』真的就『不合理』的嗎??──
─── 引自《物理哲學·下中…》