一個百年前的悖論
伯特蘭悖論是一個有關機率論的傳統解釋會導致的悖論。約瑟·伯特蘭於1888年在他的著作《Calcul des probabilités》中提到此悖論,用來舉例說明,若產生隨機變數的「機制」或「方法」沒有清楚定義好的話,機率也將無法得到良好的定義。
伯特蘭悖論的內容
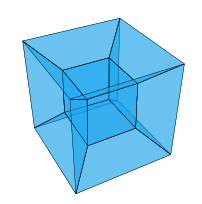
伯特蘭悖論的內容如下:考慮一個內接於圓的等邊三角形。若隨機選方圓上的個弦,則此弦的長度比三角形的邊較長的機率為何?
伯特蘭給出了三個論證,全都是明顯有效的,但導致的結果都不相同。
-

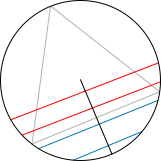
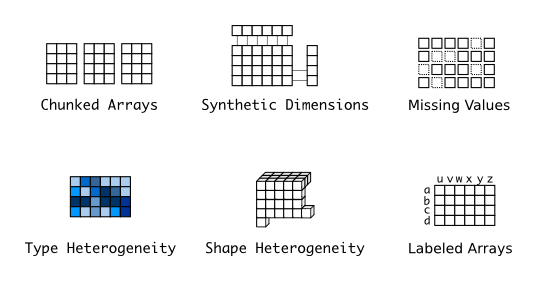
隨機的弦,方法1;紅=比三角形的邊較長,藍=比三角形的邊較短
「隨機端點」方法:在圓周上隨機選給兩點,並畫出連接兩點的弦。為了計算問題中的機率,可以想像三角形會旋轉,使得其頂點會碰到弦端點中的一點。可觀察 到,若另一個弦端點在弦會穿過三角形的一邊的弧上,則弦的長度會比三角形的邊較長。而弧的長度是圓周的三分之一,因此隨機的弦會比三角形的邊較長的機率亦 為三分之一。
-
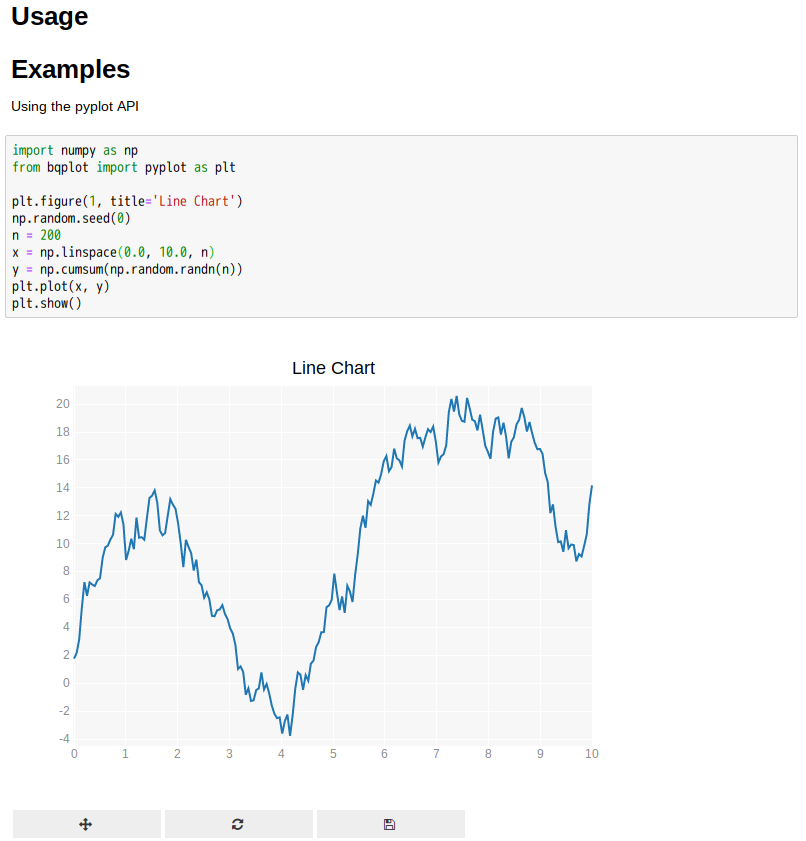
隨機的弦,方法2
「隨機半徑」方法:選擇一個圓的半徑和半徑上的一點,再畫出通過此點並垂直半徑的弦。為了計算問題的機率,可以想像三角形會旋轉,使得其一邊會垂直於半 徑。可觀察到,若選擇的點比三角形和半徑相交的點要接近圓的中心,則弦的長度會比三角形的邊較長。三角形的邊會平分半徑,因此隨機的弦會比三角形的邊較長 的機率亦為二分之一。
-
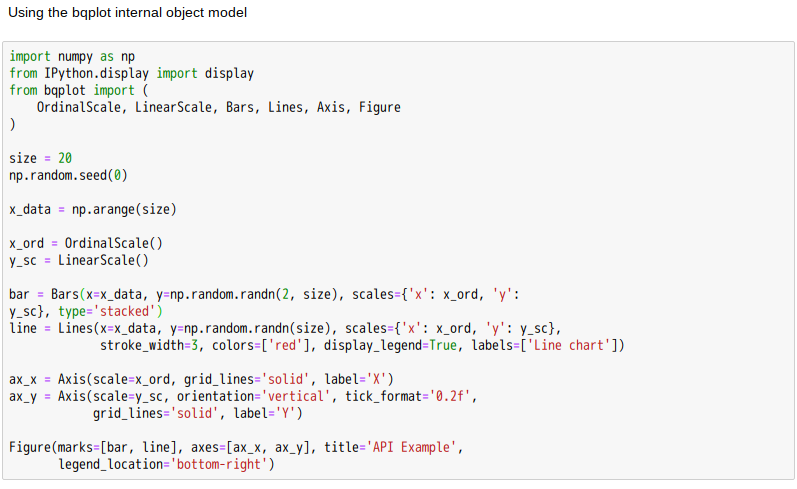
隨機的弦,方法3
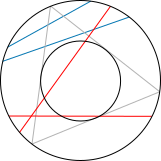
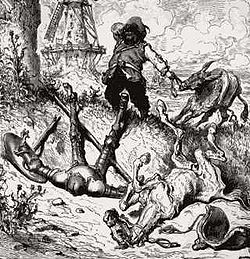
「隨機中點」方法:選擇圓內的任意一點,並畫出以此點為中點的弦。可觀察到,若選擇的點落在半徑只有大圓的半徑的二分之一的同心圓之內,則弦的長度會比三角形的邊較長。小圓的面積是大圓的四分之一,因此隨機的弦會比三角形的邊較長的機率亦為四分之一。
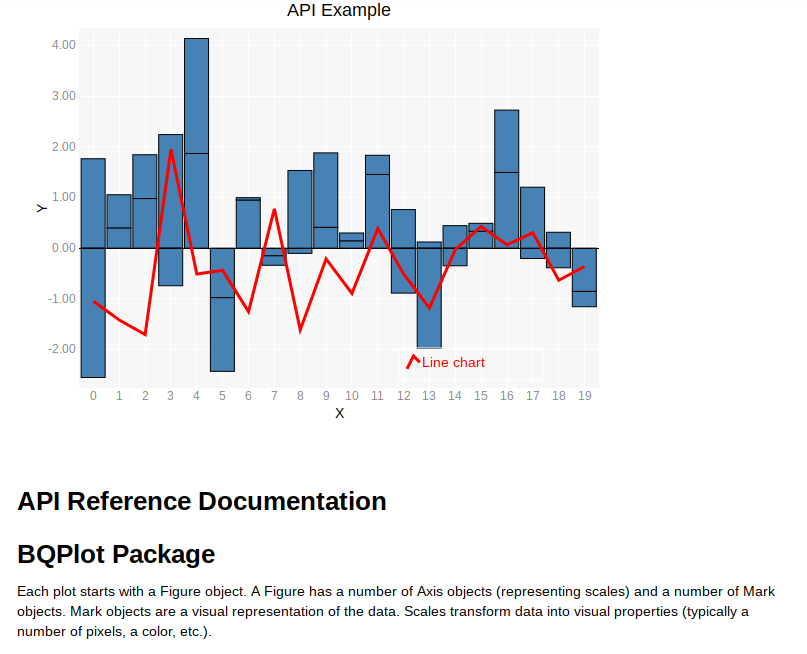
上述方法可以如下圖示。每一個弦都可以被其中點唯一決定。上述三種方法會給出不同中點的分布。方法1和方法2會給出兩種不同不均勻的分布,而方法3則會給出一個均勻的方法。但另一方面,若直接看弦的分布,方法2的弦會看起來比較均勻,而方法1和方法3的弦則較不均勻。
還可以想出許多其他的分布方法。每一種方法,其隨機的弦會比三角形的邊較長的機率都可能不一樣。
至今依舊無解。試想任一實數的『開區間』都可以對應整體實數 ,那麼『樣本空間』之『機率測度』能不謹慎乎?就像一個處處連續但卻處處不可微分的函数令人驚訝!
一八七二年,現代分析之父,德國的卡爾‧特奧多爾‧威廉‧魏爾斯特拉斯 Karl Theodor Wilhelm Weierstraß 給出一個處處連續但卻處處不可微分的這種非直覺性之函数︰

其中  為正的奇數,使得:
 。
。
─── 《時間序列︰伯特蘭悖論》
這個伯特蘭悖論,維基百科給了個
問題的傳統解答認為關鍵在於「隨機」選擇弦的方法。若選定了隨機選擇的方法,問題自然也就會有良好定義的解答。既然不存在一個唯一的選擇方法,那麼也就不存在一個唯一的解答。伯特蘭提出的這三種解答分別對應不同的選擇方法,若沒有更進一步的資訊,也沒有理由認為其中的一個解答會比另一個解答更好。
機率論的傳統解釋所導致的伯特蘭悖論和其他悖論產生了幾個更嚴謹的範規,其中包括頻率機率和貝葉斯機率。
彷彿帶點『求仁得仁,求義得義』、『仁者見仁,智者見智』的味道!就像這位傑尼斯
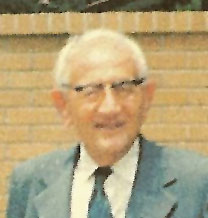
Edwin Thompson Jaynes (July 5, 1922 – April 30,[1] 1998) was the Wayman Crow Distinguished Professor of Physics at Washington University in St. Louis. He wrote extensively on statistical mechanics and on foundations of probability and statistical inference, initiating in 1957 the MaxEnt interpretation of thermodynamics,[2][3] as being a particular application of more general Bayesian/information theory techniques (although he argued this was already implicit in the works of Gibbs). Jaynes strongly promoted the interpretation of probability theory as an extension of logic.
───
先生將波利亞之『似合理的』Plausible 『推理』系統化,
喬治‧波利亞
George Pólya
How to Solve It
suggests the following steps when solving a mathematical problem:
1. First, you have to understand the problem.
2. After understanding, then make a plan.
3. Carry out the plan.
4. Look back on your work. How could it be better?
If this technique fails, Pólya advises: “If you can’t solve a problem, then there is an easier problem you can solve: find it.” Or: “If you cannot solve the proposed problem, try to solve first some related problem. Could you imagine a more accessible related problem?”
─── 摘自《物理哲學·下中……》
把『機率論』帶入邏輯殿堂,
he material available from this page is a pdf version of E.T. Jaynes’s book.
Introduction
Please note that the contents of the file from the link below is slightly of out sync with the actual contents of the book. The listing on this page correspond to the existing chapter order and names.
……
── 摘自《W!O+ 的《小伶鼬工坊演義》︰神經網絡【學而堯曰】七》
想求得邏輯『唯一解』也!!
雖然傑尼斯 的論述很有啟發性︰
In his 1973 paper “The Well-Posed Problem“,[2] Edwin Jaynes proposed a solution to Bertrand’s paradox, based on the principle of “maximum ignorance”—that we should not use any information that is not given in the statement of the problem. Jaynes pointed out that Bertrand’s problem does not specify the position or size of the circle, and argued that therefore any definite and objective solution must be “indifferent” to size and position. In other words: the solution must be both scale and translation invariant.
To illustrate: assume that chords are laid at random onto a circle with a diameter of 2, for example by throwing straws onto it from far away. Now another circle with a smaller diameter (e.g., 1.1) is laid into the larger circle. Then the distribution of the chords on that smaller circle needs to be the same as on the larger circle. If the smaller circle is moved around within the larger circle, the probability must not change either. It can be seen very easily that there would be a change for method 3: the chord distribution on the small red circle looks qualitatively different from the distribution on the large circle:
The same occurs for method 1, though it is harder to see in a graphical representation. Method 2 is the only one that is both scale invariant and translation invariant; method 3 is just scale invariant, method 1 is neither.
However, Jaynes did not just use invariances to accept or reject given methods: this would leave the possibility that there is another not yet described method that would meet his common-sense criteria. Jaynes used the integral equations describing the invariances to directly determine the probability distribution. In this problem, the integral equations indeed have a unique solution, and it is precisely what was called “method 2” above, the random radius method.
,但是我們事實無法先驗的知道大自然會有多種統計學︰
麥克斯韋-玻爾茲曼統計
費米-狄拉克統計
玻色-愛因斯坦統計
因此,統計之觀察、推論以及分析,豈能不注意其『假設檢定』的程序乎?
A statistical hypothesis, sometimes called confirmatory data analysis, is a hypothesis that is testable on the basis of observing a process that is modeled via a set of random variables.[1] A statistical hypothesis test is a method of statistical inference. Commonly, two statistical data sets are compared, or a data set obtained by sampling is compared against a synthetic data set from an idealized model. A hypothesis is proposed for the statistical relationship between the two data sets, and this is compared as an alternative to an idealized null hypothesis that proposes no relationship between two data sets. The comparison is deemed statistically significant if the relationship between the data sets would be an unlikely realization of the null hypothesis according to a threshold probability—the significance level. Hypothesis tests are used in determining what outcomes of a study would lead to a rejection of the null hypothesis for a pre-specified level of significance. The process of distinguishing between the null hypothesis and the alternative hypothesis is aided by identifying two conceptual types of errors (type 1 & type 2), and by specifying parametric limits on e.g. how much type 1 error will be permitted.
An alternative framework for statistical hypothesis testing is to specify a set of statistical models, one for each candidate hypothesis, and then use model selection techniques to choose the most appropriate model.[2] The most common selection techniques are based on either Akaike information criterion or Bayes factor.
Confirmatory data analysis can be contrasted with exploratory data analysis, which may not have pre-specified hypotheses.
…
Cautions
“If the government required statistical procedures to carry warning labels like those on drugs, most inference methods would have long labels indeed.”[15] This caution applies to hypothesis tests and alternatives to them.
The successful hypothesis test is associated with a probability and a type-I error rate. The conclusion might be wrong.
The conclusion of the test is only as solid as the sample upon which it is based. The design of the experiment is critical. A number of unexpected effects have been observed including:
- The clever Hans effect. A horse appeared to be capable of doing simple arithmetic.
- The Hawthorne effect. Industrial workers were more productive in better illumination, and most productive in worse.
- The placebo effect. Pills with no medically active ingredients were remarkably effective.
A statistical analysis of misleading data produces misleading conclusions. The issue of data quality can be more subtle. In forecasting for example, there is no agreement on a measure of forecast accuracy. In the absence of a consensus measurement, no decision based on measurements will be without controversy.
The book How to Lie with Statistics[16][17] is the most popular book on statistics ever published.[18] It does not much consider hypothesis testing, but its cautions are applicable, including: Many claims are made on the basis of samples too small to convince. If a report does not mention sample size, be doubtful.
Hypothesis testing acts as a filter of statistical conclusions; only those results meeting a probability threshold are publishable. Economics also acts as a publication filter; only those results favorable to the author and funding source may be submitted for publication. The impact of filtering on publication is termed publication bias. A related problem is that of multiple testing (sometimes linked to data mining), in which a variety of tests for a variety of possible effects are applied to a single data set and only those yielding a significant result are reported. These are often dealt with by using multiplicity correction procedures that control the family wise error rate (FWER) or the false discovery rate (FDR).
Those making critical decisions based on the results of a hypothesis test are prudent to look at the details rather than the conclusion alone. In the physical sciences most results are fully accepted only when independently confirmed. The general advice concerning statistics is, “Figures never lie, but liars figure” (anonymous).
……
Courtroom trial
A statistical test procedure is comparable to a criminal trial; a defendant is considered not guilty as long as his or her guilt is not proven. The prosecutor tries to prove the guilt of the defendant. Only when there is enough evidence for the prosecution is the defendant convicted.
In the start of the procedure, there are two hypotheses  : “the defendant is not guilty”, and
  : “the defendant is guilty”. The first one, , is called the null hypothesis, and is for the time being accepted. The second one, , is called the alternative hypothesis. It is the alternative hypothesis that one hopes to support.
The hypothesis of innocence is only rejected when an error is very unlikely, because one doesn’t want to convict an innocent defendant. Such an error is called error of the first kind (i.e., the conviction of an innocent person), and the occurrence of this error is controlled to be rare. As a consequence of this asymmetric behaviour, an error of the second kind (acquitting a person who committed the crime), is more common.
| |
H0 is true
Truly not guilty |
H1 is true
Truly guilty |
Accept null hypothesis
Acquittal |
Right decision |
Wrong decision
Type II Error |
Reject null hypothesis
Conviction |
Wrong decision
Type I Error |
Right decision |
A criminal trial can be regarded as either or both of two decision processes: guilty vs not guilty or evidence vs a threshold (“beyond a reasonable doubt”). In one view, the defendant is judged; in the other view the performance of the prosecution (which bears the burden of proof) is judged. A hypothesis test can be regarded as either a judgment of a hypothesis or as a judgment of evidence.
………
Philosopher’s beans
The following example was produced by a philosopher describing scientific methods generations before hypothesis testing was formalized and popularized.[29]
Few beans of this handful are white.
Most beans in this bag are white.
Therefore: Probably, these beans were taken from another bag.
This is an hypothetical inference.
The beans in the bag are the population. The handful are the sample. The null hypothesis is that the sample originated from the population. The criterion for rejecting the null-hypothesis is the “obvious” difference in appearance (an informal difference in the mean). The interesting result is that consideration of a real population and a real sample produced an imaginary bag. The philosopher was considering logic rather than probability. To be a real statistical hypothesis test, this example requires the formalities of a probability calculation and a comparison of that probability to a standard.
A simple generalization of the example considers a mixed bag of beans and a handful that contain either very few or very many white beans. The generalization considers both extremes. It requires more calculations and more comparisons to arrive at a formal answer, but the core philosophy is unchanged; If the composition of the handful is greatly different from that of the bag, then the sample probably originated from another bag. The original example is termed a one-sided or a one-tailed test while the generalization is termed a two-sided or two-tailed test.
The statement also relies on the inference that the sampling was random. If someone had been picking through the bag to find white beans, then it would explain why the handful had so many white beans, and also explain why the number of white beans in the bag was depleted (although the bag is probably intended to be assumed much larger than one’s hand).
也許可以藉著『議題』︰
淑女品茶是一個有關假設檢定的著名例子[2],費雪的一個女同事聲稱可以判斷在奶茶中,是先加入茶還是先加入牛奶。費雪提議給她八杯奶茶,四杯先加茶,四杯先加牛奶,但隨機排列,而女同事要說出這八杯奶茶中,哪些先加牛奶,哪些先加茶,檢驗統計量是確認正確的次數。零假設是女同事無法判斷奶茶中的茶先加入還是牛奶先加入,對立假設為女同事有此能力。
若單純以機率考慮(即女同事沒有判斷的能力)下,八杯都正確的機率為1/70,約1.4%,因此「拒絕域」為八杯的結果都正確。而測試結果為女同事八杯的結果都正確[3],在統計上是相當顯著的的結果。
In the design of experiments in statistics, the lady tasting tea is a randomized experiment devised by Ronald Fisher and reported in his book The Design of Experiments (1935). The experiment is the original exposition of Fisher’s notion of a null hypothesis, which is “never proved or established, but is possibly disproved, in the course of experimentation”.[3]
The lady in question (Muriel Bristol) claimed to be able to tell whether the tea or the milk was added first to a cup. Fisher proposed to give her eight cups, four of each variety, in random order. One could then ask what the probability was for her getting the specific number of cups she identified correct, but just by chance.
Fisher’s description is less than 10 pages in length and is notable for its simplicity and completeness regarding terminology, calculations and design of the experiment.[4] The example is loosely based on an event in Fisher’s life. The test used was Fisher’s exact test.
The experiment asked whether a taster could tell if the milk was added before the brewed tea, when preparing a cup of tea
鍛鍊『統計思維』!!
或許也該參考『極點』︰
有些長期從事科學的教育者,發現數理學習的困難度,可以排列成『邏輯』<『數學』<『機率』這樣的次序。這可讓人覺得十分有意思,難道是說『必然的』<『抽象的』<『不確定』?或許人們不能輕易覺察之『無意識』的『參照點』就是對事物觀點『兩極化』的由來。就好像在《改不改??變不變!!》一文中所談到的一些『悖論』彷彿是『腦筋急轉彎』的一般!
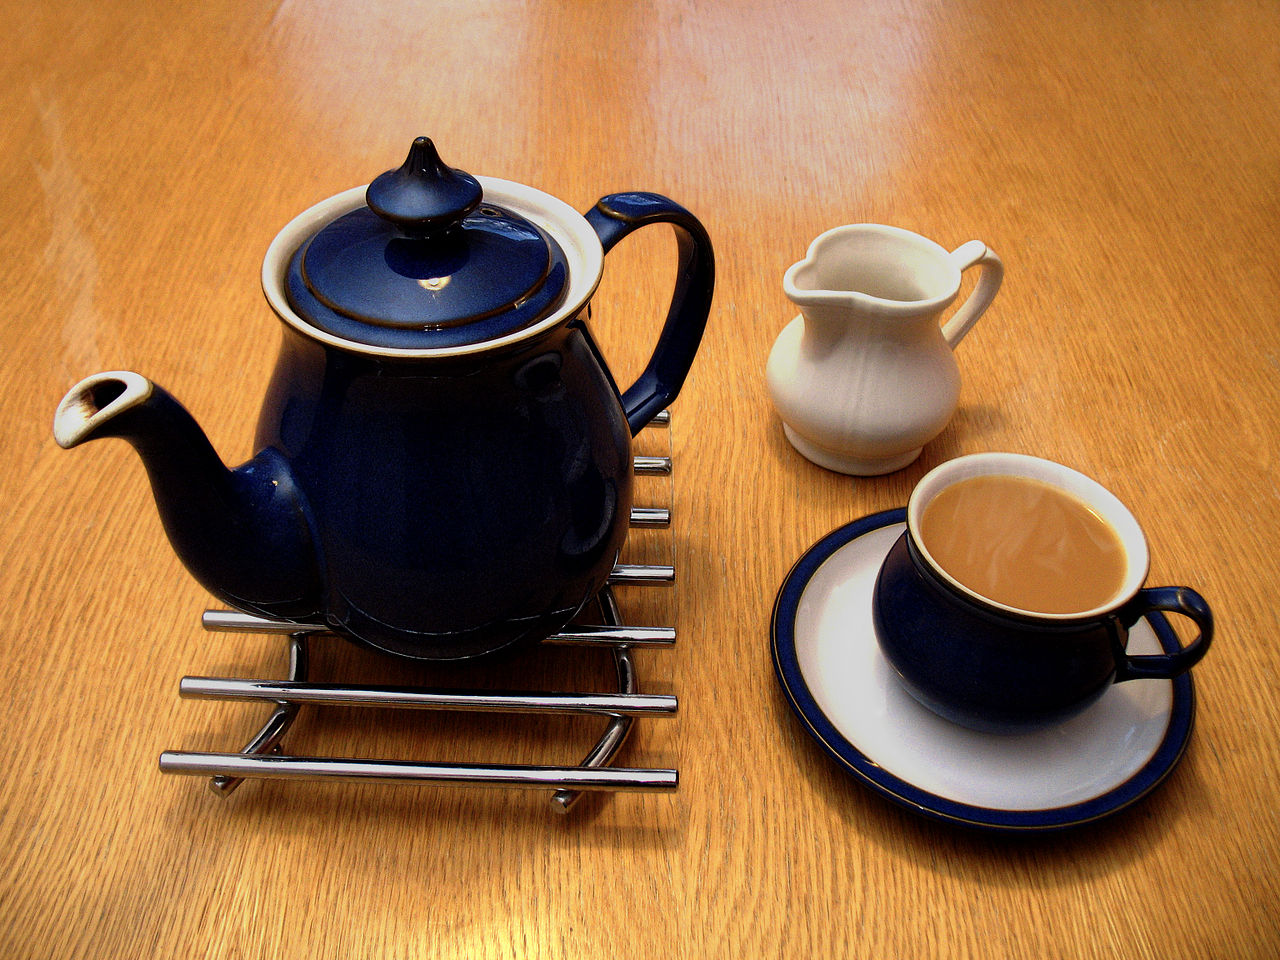
唐吉訶德‧大戰風車
西班牙作家塞萬提斯名著
《唐吉訶德》開場白︰
En un lugar de la Mancha, de cuyo nombre no quiero acordarme, no ha mucho tiempo que vivía un hidalgo de los de lanza en astillero, adarga antigua, rocín flaco y galgo corredor.
曼查有個地方,地名就不用提了,不久前住著一位貴族。他那樣的貴族,矛架上有一支長矛,還有一面皮盾、一匹瘦馬和一隻獵兔狗。
《唐吉訶德》裡有一段,說︰
桑丘‧潘薩在他治理的島上頒布一條法例,規定過橋的旅客必需誠實地表示自己的目的,否則就要接受絞刑。 有一個旅客在見到橋上的告示後,宣稱自己過橋是要接受絞刑的。
這使執法者感到為難:如果旅客的言論為真,則他應被釋放並不得受絞刑,但如此一來旅客言論即變為假。如其言論為假,則他會被絞死,但如此一來其言論即變為真。該旅客被帶到桑丘面前,而桑丘最後把他釋放。
一六零五年始,塞萬提斯寫了一本『反騎士』的小說,他怎知四百年後,美國的百老匯將其『唐吉訶德』變裝成了『逐夢者』。『正港』是有著『阿 Q 精神』的『夢幻騎士』,勇往直前『非理性』的『挑戰』當代社會中的一切『不合理性』現象,絕不退縮。宛如許多的『悖論』常起源於『自我指涉』之『誤謬』,為什麼呢?
『人的行為』並不外於他的『整體行為』,『人之言思』也屬於他的『全部言思』。於是乎,在『日久天長』中,難到不可能發生,有『一鬼』以為︰它並非『已死之人』,又有『一人』認為︰他就是『活著的鬼』。如果說︰昨日之我,譬如今日死;那麼今日之我,就將明日亡。如是議論,人麽真的能理解『時間』是什麼?『光陰』之所以是『公平』的,或許祇在於『如何使用』操之在人的吧!就像一個『推動』社會的『改革者』,期盼能免於︰先生,他們敗壞了所有價值,我們打垮了他們,不過我們也不知道如何重建那些他們曾經打垮之價值的哩!!
─── 摘自《物理哲學·下中………》
足以『腦筋急轉彎』??
不過還是先全面理解好☆
ipython3 Python 3.5.3 (default, Jan 19 2017, 14:11:04) Type "copyright", "credits" or "license" for more information. IPython 5.1.0 -- An enhanced Interactive Python. ? -> Introduction and overview of IPython's features. %quickref -> Quick reference. help -> Python's own help system. object? -> Details about 'object', use 'object??' for extra details. In [1]: from blaze import * /usr/local/lib/python3.5/dist-packages/blaze/server/server.py:17: ExtDeprecationWarning: Importing flask.ext.cors is deprecated, use flask_cors instead. from flask.ext.cors import cross_origin In [2]: 帳戶 = Symbol('帳戶', 'var * {"編號": int, "開戶人": string, "金額": int ...: }') In [3]: 壞帳 = 帳戶[帳戶.金額 < 0].開戶人 In [4]: L = [[1, 'Alice', 100], ...: [2, 'Bob', -200], ...: [3, 'Charlie', 300], ...: [4, 'Denis', 400], ...: [5, 'Edith', -500]] In [5]: list(compute(壞帳,L)) Out[5]: ['Bob', 'Edith'] In [6]:

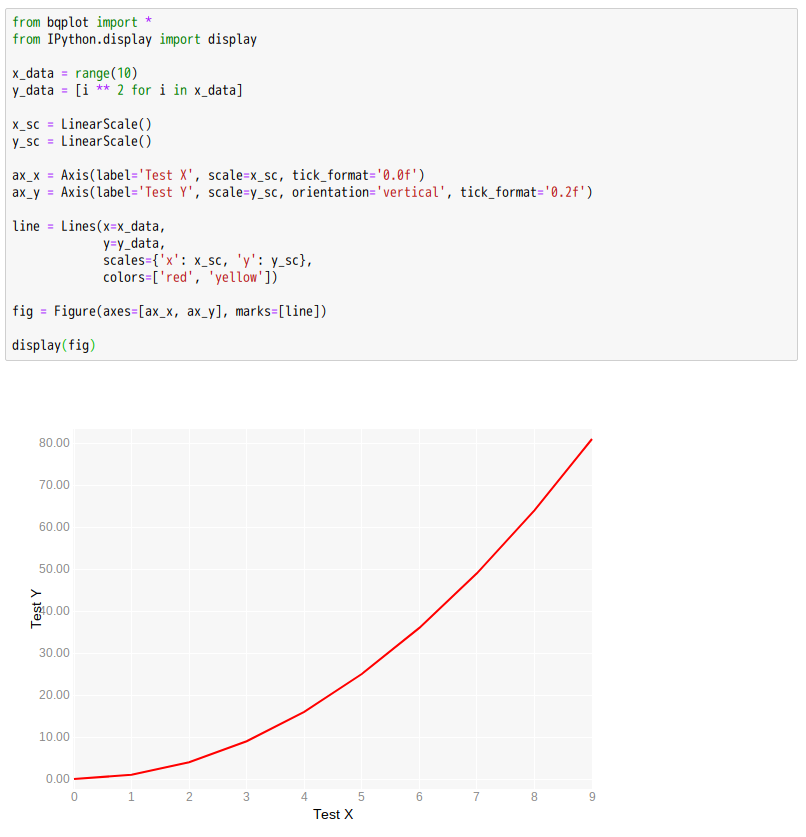

 (分別精確到小數點後兩位和三位)


 真,
真,  真。
真。 真,
真, 
dhirschfeld commented Jun 6, 2018